“Smart Column (March Issue)” Cheap U.S. dollar presents the opportunity to buy in, waiting for another grand bull market trend to reappear.

Written in Feb 13th, 2017. 

Cheap U.S. dollar presents the opportunity to buy in, waiting for another grand bull market trend to reappear.

US Dollar Index will reach a new height since the recession.

In the course of the past two years, as United States ended the QE stimulus programme and started the rate-rising cycle, US Dollar Index has begun its long-term bull market trend. However, since the market fluctuates rapidly, if investors fail to trade in the right moment, starting to move along with the market atmosphere, it would often end up chasing for nothing. On such note, it is pleasing to see that over the past two years, we have pointed out in June 2015 and July 2016 that the right timing for buying US dollars (see chart 1). And by reviewing the outcome, our strategy is spot on. In this article, we are to inform you that after the correction happened at the beginning of this year, US Dollar Index is now showing an excellent opportunity to invest, and this time the gain will be significant.1

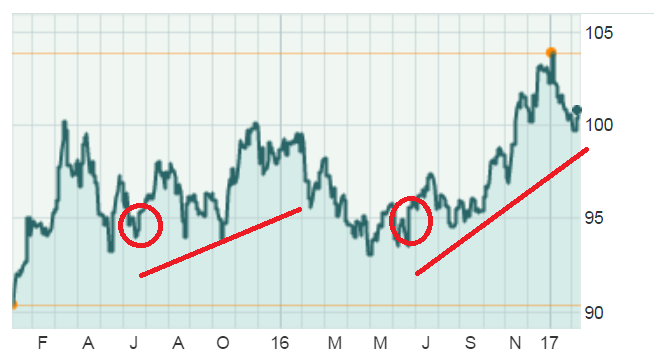
Chart 1. The red circles show the timing when we predict longing U.S. currency over the past two years, providing investors decent returns.  Unit: index  Source: Marketwatch

Why is the upcoming quarter the perfect opportunity to invest in US dollars? There are three major factors based on the economic fundamentals that will lay out a great chance to buy in at a lower price.

A. The trading statistics indicate that US dollars will go weak then strong.

2
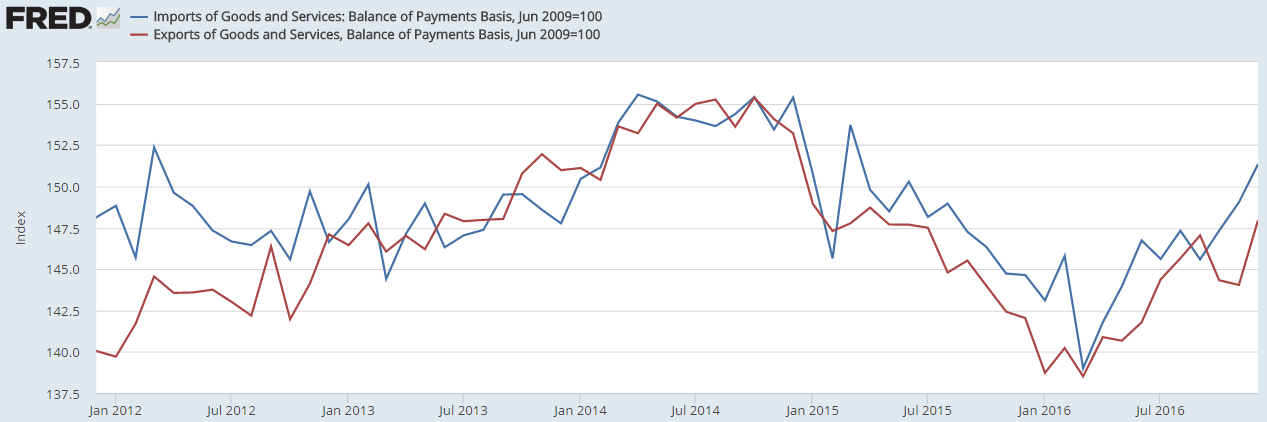
Chart 2. U.S. imports (blue) vs exports, imports is speeding up faster than exports.  Unit: index   Source: FRED

As the US and global economy are starting to expand prominently, the status of US import and export keeps getting better (see chart 2). Specifically, the import numbers are showing a great acceleration. It suggests that besides the increasing actual needs that contribute to the numbers, there are other factors at play! What is the cause of it? Basically, it is related to the Border Adjustment Tax that President Trump and Republican congress are beginning to discuss. The new tax bill is going to charge all import goods a 20% import duties (the tax rate is undetermined; it resembles other countries’ import value-added tax), and duty free for export goods. The bill will be going through the legislative process approximately this spring; therefore, companies with import business will begin to increase their imports as early as possible, in order to avoid the impact of the new tax bill. And due to the recent spike of sales in US, the inventory level has come to a new low point of the last two years. Thus, the increasing needs for import goods will become more apparent in the next six months (see chart 3).

3
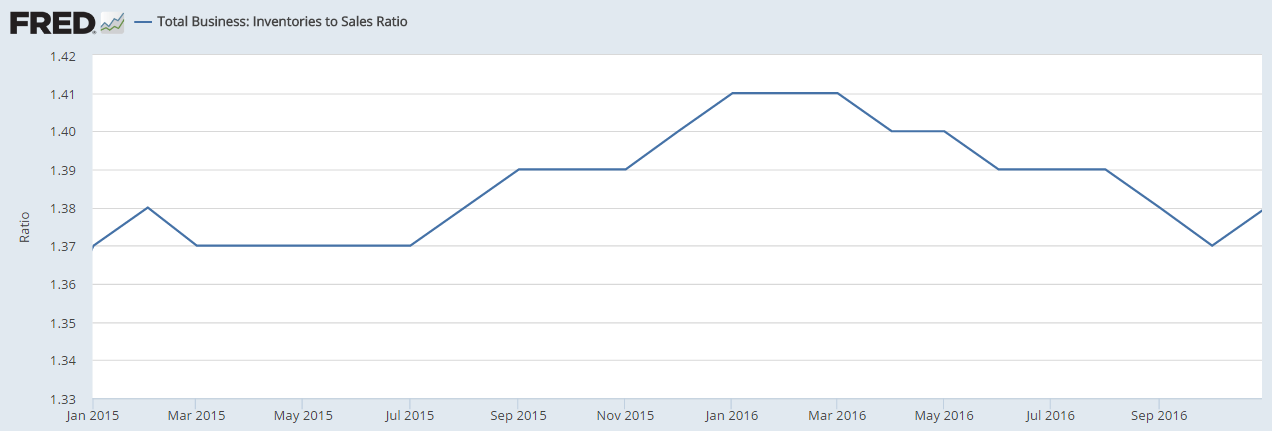
Chart 3. U.S. inventories to sales ratio: steadily improved in last year, companies worked hard to digest inventories.  Unit: %  Source: FRED

Under such circumstances, since that current account is the key element to determine the long-term trend of exchange rate, during this short period of expanding imports of goods, US dollars will suffer from certain pressure, and also affecting the trend of other currencies. However, making early expansion of imports still has a limit. As the details of the new policy settled, and putting in motion in the 4th quarter this year (new fiscal year in 2018) to next year, such increasing needs for imports will be replaced by another cycle of dealing with inventories. Then, the whole trading trend and other non-US market’s exports needs will be reversed, or even emerges a bigger need gap. Then, the US trade deficit will significantly decrease, and so will other countries’ trade surplus, which would lead to US dollars appreciating to a new height.

B. The inflation statistics indicate that US dollars will reach the bottom and bounce back.

The second factor that the US dollars will gradually reach the bottom and start to bounce back is the trend of US inflation. It will significantly affect the interest rate of US in the future, and also affect the possible trend of US dollar Index. The numbers of inflation are relative, which means that the inflation numbers of US should be compared to other major corresponding countries. And looking from US Dollar Index’s point of view, it would be the trend of Inflation in the euro area. We can see in chart 4, since 2011, the numbers of US inflation usually are better than the ones in euro area. In that case, the US currency strategy comparing to euro area is rather tighter in a long term period. This is also the reason that the bull market of US dollar has continued for six years.

4
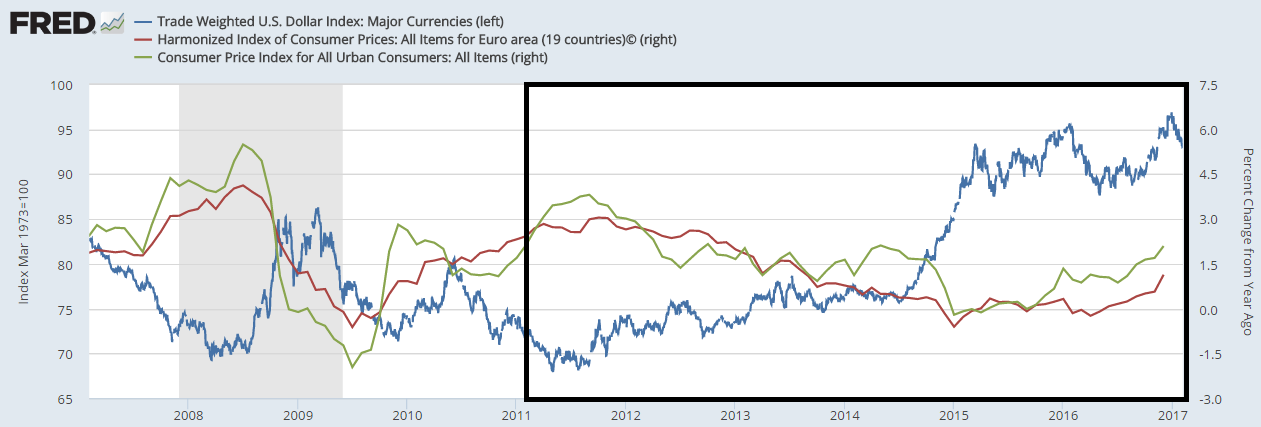
Chart 4. Trade weighted U.S. Dollar Index (blue) vs Harmonized Index of Consumer Prices in Euro area YOY (red) vs Consumer Price Index YOY in U.S. (green)  Unit: index, %, %    Source: FRED

And the most important reason causing the recent euro bounce back, and the US Dollar Index setback, is because of the inflation in euro area has started to warm up. In December, the level of inflation has reached a new height of 1.1% in the last three years. As the base period is lower, the level of inflation in euro area can maintain at 1-1.5% in the first half year. It is safe to say that the deflation crisis of euro area is relieved momentarily. As to the reason that the inflation level can rise in euro area this time, besides from its own gain of economic recovery, a great deal is contributed from the rising oil price and strong US currency. Since the rising price of commodities affect the inflation in both US and euro area, the rise of inflation level in euro area is greatly contributed by the strong US currency. In other words, US currency needs to stay strong, for euro to have the capacity to continue improving through inflation, and in the longer future, has the chance to shift the currency policy and stimulate the euro to appreciate. Yet, this scenario still needs time to accumulate to realize, and it will not take place in this year at least.

Why? The main reason is the new policy of custom duties of Trump government we mentioned above. It will not only greatly increase the imports price level, but also increase the price of domestic commodities (since oil and commodities imports currently do not seem to be duty-free). This will heat up the possible gradual inflation in the later half year that benefits from low base period. Then, combining with a booming employment market, tax cut and expanding infrastructure constructions all in motion, the inflation level and interest rate of US will significantly increase and accelerate, and pushing the US dollars to appreciate.

C. US economic growth is still better than other major countries.

5
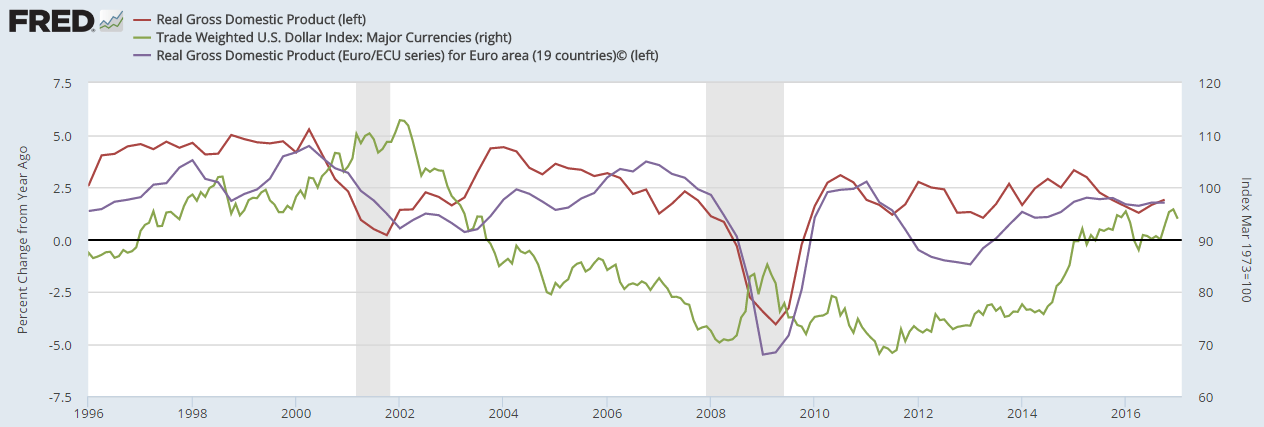
Chart 5. U.S. GDP YOY (red) vs Euro area GDP YOY (purple) vs Trade weighted U.S. Dollar Index (green)  Unit: %, %, index    Source: FRED

The last key factor that will affect global currencies and capital movements, is the economic fundamentals. We can see in chart 5, Trade Weighted US Dollar Index in the past twenty years has gone through two bull market and one bear market cycle. The most important factor relating to this, is that after European Union expanded east, there was a rapid growth in euro area in the beginning of this century, and US Dollar Index is also at a relatively high position. Then, the decline kept moving downwards, until after the recession in 2008. After the recession, due to the European debt crisis and the new emerging European market began to stale, the economic growth of euro area started to fall behind US.

What about the future? Although the economic growth in the euro area last year (2016) finally surpassed US in the past ten years (1.7% vs 1.6%), US Dollar Index also began to go weak in the start of this year, this is not a shift of the long term trend. As shown in chart 6, in the first three quarters of last year (the statistics of the 4th quarter is not yet announced when this article is written), the needs of exports (first chart to the left) has been a great help. Even though the domestic needs in the euro area has increased, it is roughly the same as the recovery base period since 2014. And last year, the private investment and inventories in the euro area for the first three quarters are pretty weak. This circumstance is very different from US, for its economic growth is basically all supported by the private consumption (see chart 7). Last year, the increase of domestic needs in US is doubled than the euro area. The increase of domestic needs is the most important factor of whether the local economy can maintain a long term expansion. In other words, the prominent economy performance last year in the euro area, or to say that the euro area can recover and start heating up the economy, the weak euro currency leading an increase in exports needs is notably the great help.

6
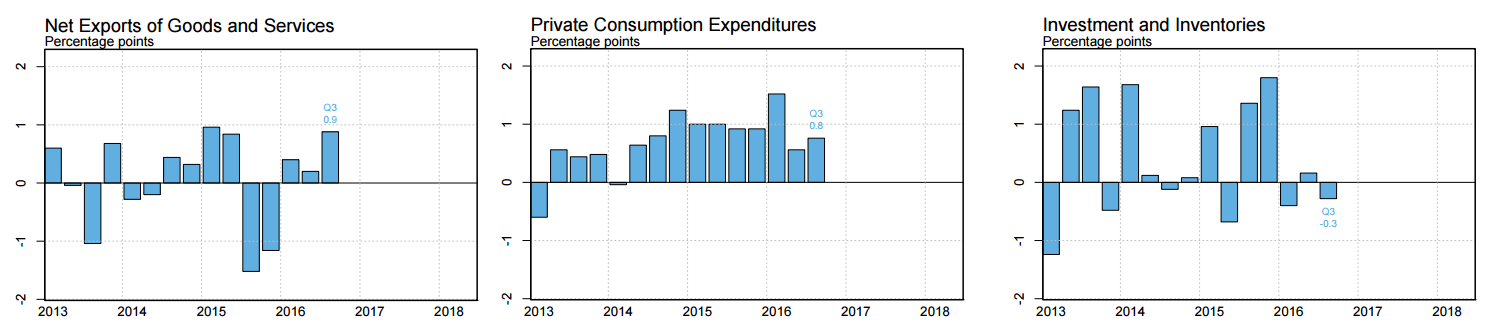
Chart 6. Net exports to GDP (left) , Private Consumption Expenditures to GDP, Investment and Inventories to GDP    Unit: %    Source: FRBNY
7
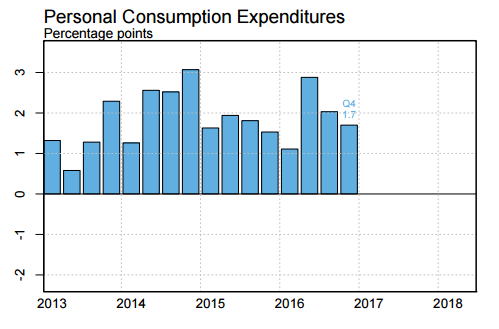
Chart 7. U.S. Personal Consumption Expenditures: supporting the entire GDP growth    Unit: %    Source: FRBNY

Obviously, due to last year’s lower base period of private consumption and investment in the euro area, it should be doing rather well this year. However, the base period of US private investments and inventories is also pretty low, and should be doing pretty well this year. Overall, the euro area still relies on the increase of exports needs, and the benefits of lower base period, thus, the trend of surpassing US economy growth might just be a spark in the pan (the numbers still need to be confirmed and finalized as well since the US GDP in the 4th quarter and last year might have a small increase). This year, US will still beat the euro area in economic growth at about 0.5%-1%. Thus, the bull market trend for the US currency will maintain its course.

Investing timing: seize the moments before the 3rd rate rise and invest separately.

Due to the early imports trend in US, that ignites the market sales and early consumption sales, the price of commodities in the market will rise, and eventually resulting the booming capital market in US and the globe, and heat up the trend of inflation. Thus, whether there would be a rate rise in March or not, it is certain that there will be a third rate rise in the first half year. According to the experience in the past three years, three months before the announcement of major currency policy is the best time to buy in US Dollar Index. The three time period are listed below (can also see chart 8):

  1. October 29th, 2014, US ended the QE stimulus programme (the end of currency easing cycle).
  2. December 16th, 2015, the first rate rise for the past ten years in US (the start of currency tightening cycle).
  3. December 14th, 2016, the second rate rise in US (confirming the currency tightening cycle).

The three time periods are the green circles in the chart below. The purple circles are the periods three months before the according rate policies, which are the best timings to long the US Dollar Index.

8
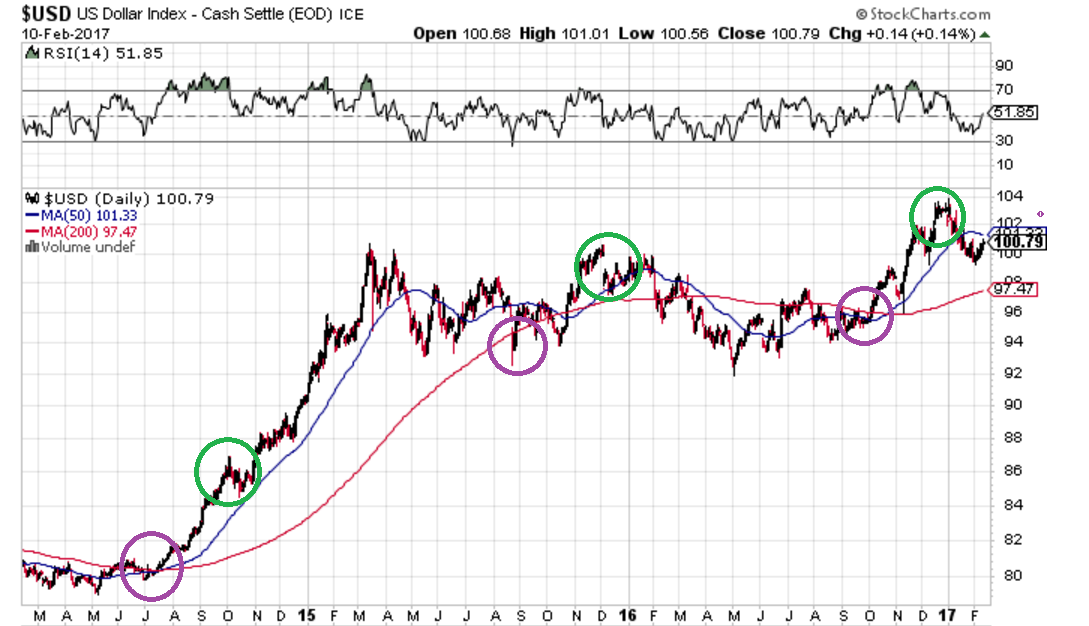
Chart 8. U.S. Dollar Index chart in the past three years: three months before crucial decisions are the best timings to buy in.    Unit: index    Source: Stockcharts

Simply put, investment is to buy at the expectation and sell at the realization. When rate rise is a reality, and everyone is optimistic about US currency, and not so excited about euro and emerging markets currencies at the start of this year, US currency began to depreciate, and euro and emerging markets currencies are doing rather well. And when the public starts focusing on markets outside of US and emerging markets’ increasing economy growth, and neglects the possible impacts of the next rate rise, it would then be a good timing to start invest in US Dollar Index! Besides the US Dollar Index will have a steady position in the upcoming quarters, as the influence the rate rise sets in, it will cause the capital market and emerging markets currency certain amount of pressure. Therefore, you can long the US Dollar Index at a lower price at the time period we have suggested in the past two years, you should also do the exchange of other currencies (including US Dollar Index currencies, CNY, NTD, and emerging markets currencies) to US currency in the second quarter, in order to avoid the depreciation risk resulted from the rate rise cycle each quarter in the US.

Disclaimer:

The information and comment in this article is for reference only. Readers using this website should acknowledge that the company shall not be liable to you for any direct, indirect, punitive, incidental, special or consequential damages arising out of or in any way connected with the use of or access to the website or for any information obtained through the website. Any reliance upon any such opinion, advice, statement, memorandum, or information shall be at readers’ sole risk.


banner


“Smart Column (March Issue)” Russia Climbs Out of the Slump, Long-term Investment Opportunities Surfaced.

Written in Feb 12th, 2017.

Russia climbs out of the slump, long-term investment opportunities surfaced.

One of the few highlight emerging markets.

In the book “Shooting for DJI 30,000  – The Century’s Great Market Opportunity that You Shouldn’t Miss” that published in 2014, we were not so optimistic about Russia’s economy and capital markets development. Around January 2015, we once again reminded everyone in our column that Russia was not an ideal portfolio for investing. Based on Chart A, you can realize that there is a reason why we were not so optimistic about Russia. Reading the ROI since 2014 or 2015, Russia was way behind U.S. and Japan stock market. Even comparing to the emerging market such as Taiwan, Russia’s performance was under as well. Three years ago, if you invested your capital in Russia stock market, you would receive a nearly minus 20% ROI, yet, the stock markets mentioned above had about 15-20% ROI (interest profits excluded). The gap is too obvious to ignore, so being cautious is indeed necessarily.

1

Chart 1. Russia stock ETF (RSX blue) vs Dow Jones (red) vs Ni225 index (orange) vs Taiwan stock ETF (EWT green)    Unit: index    Source: Google Finance

However, as the model we have been keeping all along, “every investment target is viable when the price is right.” When Russia has encountered a serious disadvantage in market (oil price drop), and the worst case scenario was over, then, the opportunity for investing will begin to surface. We believe, that in the next year or two, Russia will be one of the few highlight emerging markets that is worth investing. There are four major reasons:

A. Imports statistics showing Russia is not weak in domestic needs, improving current account will reverse the trend of Ruble depreciation.

Before going into details of Russia’s statistics, it is crucial to understand why we were quite negative about Russia over the past few years, and it would then be understandable of why we are focusing on Russia again. The reason is, a great amount of Russian government’s income, corporate profits, and GDP growth are resulted from the oil and gas sector. When these two major commodities experience a heavy price drop, it would cause the government income, corporate profits, and the wealth of the people to decrease significantly, and then the consuming capacity of the whole nation would drop enormously. The immediate effect would be a severe decline in exports, and also cannot afford the imports, thus begins a serious economic crisis. The current account would keep getting worse due to trading and capital flight, and in the end the currency would depreciate drastically. The price of imports would then rise high and cause hyperinflation, and the foreign capital flight would sink the stock market. These are the scenarios that have happened in Russia over the past few years.

2

Chart 2. Russia current account is starting to improve.  Net trade surplus (blue), Import (red) and  Export (green). Source: Stock-ai

Yet, Russia is starting to get back to the direction of another positive cycle. As the oil price starts rising from the bottom and stabilized, we can see in chart 2 that the exports of Russia start to climb out of the bottom. One more thing worth noting in the chart above is the imports of Russia. Since hitting the bottom at Q2 in 2015, it did not keep falling to bottom until Q4 last year like the exports, but rather stabilized around the bottom. Like what we said about China before, imports statistics is an important indicator of the economic strength of a nation. This also means that the domestic needs of consumption did not collapse in Russia, it has hit the lower level and started to stabilize. Simply put, it is the worst it can be.

What about the future then? As the oil price maintaining steady, the exports of Russia will see a gradual growth from a lower base period. And the slowly appreciating Ruble after the drastic depreciation can also resolve the high import cost. In other words, the current account of Russia can be expected to improve. Once the current account improves, it will help pushing the currency to reduce import cost, attracting foreign capital back to Russia, and creates a positive cycle for capital market.

3

Chart 3. Russia current account profits: the first time since the financial crisis in 1998    Unit: USD million    Source: Tradingeconomics

B. Russia inflation cools off, entering a rate reducing cycle this year.

Improving exports and current account, plus the trend of Ruble appreciation, will first let the high level of inflation in Russia begin to drop. Judging from chart 4, we can see that in order to deal with the inflation crisis caused by drastically depreciated Ruble, Russia central bank raised the interest rate up to an unprecedented 16.5% level in 2014 (see chart 4). In a sense it did restrain the inflation, but it also took down whole economic capacity. However, the inflation rate has now come to a regular 5% level, and the interest rate is still at 10%, which is obviously too high. Thus, we can expect this year that Russia will have a rate reducing cycle.

4

Chart 4. Russia inflation rate (blue) vs Russia interest rate (black): the inflation is cooling off, and the rate reducing cycle is about to begin    Unit: %    Source: Tradingeconomics

Is reducing rate beneficial, especially while U.S. is going into a rate rising cycle? In our opinion, it might not be good measures for other emerging countries, but it is definitely very positive for Russia. How so? Since the reason for Ruble to depreciate, unlike other emerging countries, is not about the interest margin, but because of the rapid deterioration of the current account, which is a result of the oil price fluctuation. Thus, once the core issue of current account is addressed, it will stop the currency to depreciate, especially when Ruble is at such low base period. And since Russia went from an irregular high rate environment to a lower rate level environment that can provide constant growth, it will stimulate the economy of needs for investment and consumption, therefore benefit the performance of capital market.

In that case, while other emerging countries are suffering from dealing with the impact due to U.S. rate rise (to follow it or not), Russia has less to concern about reducing rate, since their interest rate is at an unreasonable high level. When the capital becomes more easing, their currency would not depreciate (which is an advantage that other emerging countries cannot copy, since to deal with the impact of U.S. rate rising cycle, emerging countries can only raise the rate as well, and it would destroy the economy capacity of growth or burst the bubble; Yet, if they don’t raise the rate, they would be facing the crisis of currency depreciation due to capital flight). This will cause a capital flight of investments in emerging markets in the global scene, and it would become a long term opportunity to invest in Russia stock market.

C. The economic fundamentals of Russia are steadily growing strong.

The reasons mentioned above focus on the international capital flow, oil price effect, and currency policy, the third reason will reveal to you the fundamental reason to invest in Russia, which is that the economy in Russia cannot be any worse, and is heading towards a recovering cycle. Based on chart 5, the industrial production MOM of Russia has only shown negative growth in 3 months over the past 12 months, and are all shown in the first half year, while in second half, there is a 6-month consecutive growth, and the growth is speeding up as well.

5

Chart 5. Russia industrial production MOM: improves significantly over the last six months    Unit: %    Source: Tradingeconomics

6

Chart 6. Russia unemployment rate: getting better    Unit: %    Source: Tradingeconomics

Unemployment rate (chart 6) is also a good indicator. Since the second half of 2014, and the first half of 2016, we can see that Russia is suffering from the consequence of oil price drop, and the unemployment rate is deteriorating. Yet, since the second half of 2016 until present, the employment rate is improving, which indicates the economy is picking up its pace.

The good economy performance will then attract better foreign capital to invest and increase the confidence of corporate capital expenditures, which is the current positive cycle that Russia is entering.

D. Russia stock market is the most underrated market in the world.

The last point that worth noting is, after the current account is improved, the inflation resolved, the economy begins to grow, the currency begins to appreciate, and the foreign capital starts to return, Russian stock market is still at the lowest level regarding of the valuation, which is obviously unreasonable. In chart 7, if we check the CAPE fundamental valuation ratio, up until December 30th, 2016, Russia only has 5.9 in ratio, one of the lowest in all major stock markets. Judging from the PE or PB, it is very low as well.

7

Chart 7. Comparison of Russia and other countries’ fundamental valuation ratios in international equity markets    Unit: %    Source: http://www.starcapital.de/research/stockmarketvaluation

Since last August, we have been recommending Japan stock market, U.S. stock market, Taiwan stock market, and China stock market. If you’ve missed out on all of them, maybe Russia provides a relatively good access into the market. After all, amidst the later part of the bull market, often time “low valuation” and “low base period” targets are the last booming targets in the markets. And Russia stock market presents both characteristics. We are optimistic that in the next one or two years of the later part of the last global bull market, Russia stock market would have the potential of having a performance that beats the market.

Surely, we have to remind everyone, Russia is still a highly risky area of traditional geopolitics, the policy shift and the ruling of government have a higher uncertainty. Thus, no matter how optimistic we are, still have to be cautious while investing, and don’t overdo it. Be aware of the overall risk, so if there’s an incident occurs, it would be easier to get out!

Disclaimer:

The information and comment in this article is for reference only. Readers using this website should acknowledge that the company shall not be liable to you for any direct, indirect, punitive, incidental, special or consequential damages arising out of or in any way connected with the use of or access to the website or for any information obtained through the website. Any reliance upon any such opinion, advice, statement, memorandum, or information shall be at readers’ sole risk.


banner


「智富專欄(12月號)網誌版」川普時代來臨,準備好迎接「成長」和「通膨」年代

原文完成時間:11/17

川普時代來臨,準備好迎接「成長」和「通膨」年代

擴大建設和減稅將讓美經濟榮景重現

        在九月號的兩篇文章中,一文提醒大家無論總統大選結果為何,美國經濟和美股持續向上的趨勢不會改變,因此拉回皆是買點。另一篇文章則提醒,陸股受惠於國內外景氣循環轉熱,具備絕佳牛市動能。而在十月份則是提醒大家全球政府債和新興市場債的極高風險,投資人必須立即避開以免受傷,積極投資人則可伺機空方操作。如今來看,若投資人照表操課,最近三個月,相信絕對是市場上的常勝軍。

        如今,出乎市場意料之外,川普當選了。是否需要緊張?還是滿懷期待呢?本文要告訴您,究竟當前的美國經濟情勢如何,以及如何緊抓川普時代的大勢所趨!

美國經濟:蓄勢待發

        從2009年以來,在此波的景氣循環之中,izaax專欄持續幫大家緊盯景氣動向。在基本面加持下,前瞻投資趨勢正確的一方。而從今年以來,跟大家所強調的就是,美國經濟基本面方向就是「倒吃甘蔗」,在擺脫年初首次升息和油價崩跌的衝擊後,越往下半年,景氣增長動能會越強!而從最近的三大數據來看,美國經濟轉趨加速,化為現實。

一、民間消費,火熱上揚

美國經濟的重中之重,就是民間消費的動能能否維持。最新公布的10月零售銷售數據月增率,不但大增0.8%(折化年率為成長10.34%),還同時把九月的數值從0.6%上調至1.0%,以及八月的數據從-0.2%上調至0%。這不但確定第三季經濟成長率可望從2.9%上調至接近3.5%的水平,更確認第四季GDP可望輕鬆越過3.5%的較快增長門檻。參考圖一,若採用年增率來看,就可以看出零售銷售正快速加溫,10月的年增率從前月的3.23%上升至4.3%,相當亮眼!

1

圖一:美國零售銷售年增率()VS美國個人消費支出年增率():表現不俗 單位:資料來源:聖路易聯邦儲備銀行

        值得注意的是,由於美國人口結構的改變,民間消費型態從商品銷售拉動逐漸轉為服務消費拉動。從2014年以來,可以看到零售銷售額就明顯落後整體民間消費增長(PCE)。由於截至截稿為止,10月的民間消費成長數據尚未出爐,但由零售銷售大幅增加的態勢來看,將有助於拉動整體始終維持高檔的民間消費更往上層樓。

二、就業榮景,方興未艾

美國民間消費能夠維持高檔不墜甚至再度加溫,最大的關鍵就是就業榮景的維持。從圖二來看,無論是新開職缺和初領失業金人數,目前分處歷史最高檔和最低檔區間。由於這兩項就業數值從歷史經驗來看不會驟然轉向,而是會經過一段高原期(呈現倒U型)和谷底期(U型),才會反轉並呼應景氣擴張趨勢結束。從此數值來看,美國經濟榮景不會在短期內結束。

2

圖二:美國初領失業金人數()VS美國新開職缺數(單位:人、千人 資料來源:聖路易聯邦儲備銀行

值得注意的是,十月的就業報告顯示,薪資的上揚速度正在加速,來到了2.8%這個非常接近海嘯前的3%水平,這也是金融海嘯以來的最高年增率。隨著就業市場進一步的吃緊加上仍偏低的基期,接下來的一段時間,美國的薪資將持續向上攀升,而這會回過頭來更加刺激相關的民間消費和投資需求,形成正向循環。

3

圖三:美國平均時薪年增率:逼近3%重要關卡

單位:%

資料來源:聖路易聯邦儲備銀行

三、通膨揚升,回復常態

在大家都還在擔憂進入通縮的今年三月份「智富專欄(03月號)網誌版」小心!別因為避險而跳進另一個泡沫!一文中,我們特別強調市場所擔憂的通縮風險並不存在,反而要開始注意通膨轉趨向上的新趨勢,因此必須避開低息避險概念標的如美債和日/歐元。如今回顧,果然如此!

而從目前來看,通膨的揚昇已不是疑問句,而是現在進行式了!圖三顯示,無論是市場看重的消費者物價指數年增率(CPI),或是聯準會所看重的個人消費支出年增率(PCE),目前都快速地往2%目標區間邁進,若無重大意外,兩項數據都會在很快地明年上半年順利達標。而相關利率敏感的標的如債券也劇烈反應。

4

圖四:美國消費者物價指數年增率CPI()VS美國個人消費支出年增率PCE(單位:資料來源:紐約聯邦儲備銀行

        通膨的揚升有助推動原物料價格止穩、而原物料價格止穩有助拉動工業需求、通膨穩定增長有助利率的正常化、造成利率曲線變陡有助整體金融產業收益、通膨的環境也有助於民眾的消費和資產投資熱度以及國際貿易的止跌回升,最後以上這些都會回饋回到就業市場的薪資成長,而薪資成長又會回過頭來刺激經濟和通膨揚升。換句話說,美國經濟正走入新的正向回饋循環。未來的成長速率可望較前些年度有所提高。

        以上三大經濟數據驗證了我們選前的研判:無論是誰上台,美國經濟轉強的趨勢不會變。那麼在美國整體企業盈利也轉正(根據Factset預估,2016Q3標普五百成分股YOY盈利增長為2.9%,擺脫連五季負增長,全年預估也翻正為0.2%)的情況下,美股的投資價值,早已不言而喻。這也是專欄持續呼籲投資人一定要把握每個難得的拉回機會,勇敢進場布局的原因。

       美國經濟前景好,那搭配川普的新政,點出了何種新方向呢?

川普經濟學:雷根精神重現

        美國兩黨政治有個笑話,就是在財政上具有相當好的輪替精神,也就是「共和黨花錢、民主黨省錢」。但若從過去三十年經驗來看,還真有那麼點笑不出來。美國的政府赤字,在雷根和小布希時代大幅擴張,而在柯林頓和歐巴馬任內,則是呈現收斂。如今川普上台,由其所揭櫫的選前政策走向,正是師法所謂的「雷根經濟學」。既然如此,我們就要很清楚的了解,這是怎麼樣的一條路線?

        雷根經濟學的核心是所謂的供給學派經濟學(Supply-side),利用減稅和減少監管的方式,讓商業投資和消費能夠顯著成長,並進而製造更大的就業和稅收。不過雷根經濟學除了傳統的供給學派思維之外,同時也融合部分的凱因斯學派理論,也就是擴大政府的支出(這原則上和供給學派違背),在雷根任內主要擴大支出高度集中在軍事項目,激勵的軍事競賽後來間接拖垮了蘇聯,創造了美國獨強格局。至於貨幣面,面對70年代兩次石油危機的餘威,雷根主張採舉緊縮政策壓制通膨,以提高實質經濟和收入增長(更多雷根經濟學詳情,可參閱本人拙作「經濟指標告訴您&沒告訴您的事」)。

        從圖五來看,雷根時代順利壓制了高漲的通膨,並創造了平均高達4.5%的經濟增長速度,當然副作用就是每年政府新增債務都是以雙位數的增幅成長,整體政府債務八年下來更是從佔GDP比重30%出頭暴漲一倍至60%。直到柯林頓上台才有效降低美國的政府負債。

5

圖五:美國實質GDP年增率()vs聯邦政府債務()vs消費者物價指數年增率(單位:資料來源:聖路易聯邦儲備銀行

        雷根經驗告訴我們,的確利用短期的刺激,將整體GDP拉回至可持續增長的成長速度,之後再來調整政府的收支狀態,是可嘗試的一條方針。而這方針也符合先前和大家提醒的重要趨勢變化:G20國家的共識就是逐漸讓貨幣刺激退場,而以財政刺激取代。而財政刺激不外乎擴大基建和減稅,川普決定採取雙管齊下,可見其企圖心和國際一致的合作步調。

  1. 擴大基建計畫,將挽救美國長期不振的公共投資:

        川普勝選感言的第一句,除了感謝大家,第一項提到的政策,就是要擴大基礎建設,包含交通、能源、水利等。從其競選網站上,內容最為豐富和詳細地的就是基礎建設的相關計畫(延伸閱讀https://www.donaldjtrump.com/policies/an-americas-infrastructure-first-plan)。他認為,美國的基礎建設亟待修補和擴建,提出了比希拉蕊規模達兩倍的(5千億美元)的基建計畫。而過去幾年雖然小布希和歐巴馬都曾強調要過大基礎建設,但因為國會制肘和環保議題等影響,實際成效相當不彰。川普認為,公共建設的支出已刻不容緩,且美國應該利用超低的公債利率,大幅舉債進行跨世代的投資。

從經濟角度來看,公共建設的不振,和中國過度公共建設剛好形成強烈對比–過猶不及。美國水利設施的不足體現在層出不窮的缺水和水災問題、交通建設不足造成都會區嚴重的塞車無解、以及輸電線路的老舊造成能源生產的缺乏效率,這都大大影響了美國長期競爭力。龐大的基礎建設計畫,除了可以短期對整體經濟造成立即且顯著的刺激效果,長期來看,若能切中時弊,更能有效提振美國整體的生產力。而川普似乎也不僅止於著重在傳統的基礎建設,他的競選計畫特別強調,要發展次世代的交通工具,這通常意味大眾運輸、電動車將是其重要的政策選項,他甚至多次公開支持建設高速鐵路。這都大大的和以往的共和黨政策理念不同。這些計畫過去民主黨多半都在國會觸礁,但若由川普來推出,相信會事半功倍。

此外,基礎建設之中,川普特別點名,宣布要重啟美國的keystone pipeline計畫(先前因為歐巴馬的環保考量宣布停建),而這個計畫是由加拿大的產油區,經過美國的產油州,建立一條油管延伸至德州的煉油廠,這計畫將確立北美洲的能源自主可以達成,這意味OPEC和非OPEC的原油戰爭將告一段落,美國的頁岩油和加拿大油砂產業將成為無法淘汰的重要players, 這反有助於雙方走向合作(加上俄羅斯和美國合作意願也會提升)。未來一段時間在發生能源戰的機率已大幅降低,產油國會走向互助共榮(類似小布希任內榮景)。

  1. 擴大減稅,可望有效刺激經濟

川普的減稅政策,不但符合共和黨的傳統價值,又能最快施惠於一般老百姓,贏取民心立竿見影,相信會很快就會出台相關的減稅細節。在川普的競選計畫中,他有一些重要的方向指標,其中最重要的有三項:

  1. 所得稅:減稅最大受益這將是中產階級和基層勞工->這雖不符合共和黨精神,但從川普的選民結構來看,十分符合。富人仍得負擔其該有的稅負水平,不過稅負會調整到一個比較合理的水平。依照他的計畫,稅制將從七個級距簡化為三級,取消最低稅負制,因此低收入者的實質稅負將趨近於零。此外,擴大可扣抵稅率,特別是針對13歲以下的孩童提供childcare扣抵額(而且有排富條款)。的確是可以看出和一些以往共和黨政客的不同之處。
  2. 公司所得稅:美國的公司稅是已開發國家第三高,因此過高的公司稅率一直是兩黨的改革焦點。川普的計畫非常激進,他要將公司所得稅調降至15%。這幾乎將讓美國的公司稅直接從全世界最高的水平調降到幾乎是最低的水平(低於台灣的17%),同時也取消企業的最低稅負。值得注意的是,川普針對美國企業於海外免稅天堂停駐的龐大資金,提出優惠的回流減免措施,預計以十年的窗口並給予僅10%的一次性徵稅。如此低的稅負若付諸實現,有助於吸引規模高達4兆(僅S&P500企業)的海外資金回流,相關的稅收收入將達數千億元之譜。而資金回國之後,無論是匯回股利或是另做投資之用,的確會大大有助於提振美國不振的民間投資,以及挹注政府稅收。
  3. 遺產稅:川普計劃廢除遺產稅。而無論最終是調降或廢止遺產稅,雖然長線會嚴重影響稅基收入。但若從台灣的經驗來看(馬政府98年大幅調降遺產稅,該年經濟成長率為76%、隔年為3.8%,是馬政府執政時期經濟表現最好的兩年,接下來六個年度除民國103年成長率接不到3%),對於短期經濟的經濟效益,特別是資產投資(如房地產)會產生顯著刺激效果。

         川普的「稅改三箭」,因為其規模過於龐大,不可能全數執行。但稅改議題本來就是一種討價還價,在經過一定程度的妥協之後,搭配國會優勢,部分成真的可能性相當高。而減稅從以往來看,有鑑於美國是個消費驅動的國度,對於經濟的短期刺激效果將相當顯著。

結論:分歧的路徑,將帶來不一樣的榮景

      當然,大家一定會好奇,川普要搞擴大建設和減債,唯一的資金來源,還是只有擴大舉債。那這會不會讓已「債台高築」的美國債務問題雪上加霜?其實不會的。美債總額的龐大容易帶來誤解,但世人常忽略了,美國的經濟規模,也是極為巨大。若用較為客觀的公債佔GDP比重(一般國際標準是超過100%就達到警戒線)來看,美國的債務狀態,還遠優於主要的已開發國家(圖六)。若美國提升至英國或歐盟的債務水平,則美國仍具有額外的2.4-3兆美元舉債額。若提升至加拿大或的債務水平,則能享有額外的4.6兆舉債餘裕;而無論是英國、歐盟或是加拿大,普遍仍被視為財政狀態健全,可接受的水平。這意味就算美國進行大規模的舉債,在同樣的比較基準上,並不至於會「動搖國本」。更何況,而川普的計畫,無論是基建或減稅,實際上並不需要如此大規模的舉債規模。

6

圖六:美國債務佔GDP比重:和主要開發國家相比仍維持相對健康水平 單位:% 資料來源:CIA

        換另外一個角度來看,若以每年的政府赤字佔年度GDP比重(一般國際標準的警戒線是3%)。圖七顯示,依照國會預算室的預算評估,若按照當前政策走向,到2019年不但政府赤字都不會超過3%,甚至2018年前還會低於美國的歷史平均(2.7%)。換句話說,不考慮其他變數下,當前的美國就足以讓川普享有每年額外的700到一千億美元的舉債規模,而同時仍能將年度赤字佔GDP比重順利壓在3%以下。值得注意的是,此計算規模是採用一個非常保守的經濟預估(國會預算室已將長期經濟成長率調降至2.2-2.4%),若屆時川普的措施奏效,順利將美國的經濟成長率往上拉高,那就會騰出更多的舉債空間(例如若提高1%的名目GDP增長率,就能多出約60億美元的舉債額度而不拉高負債比)。更何況,在經濟成長的過程中,政府的稅收也會不減反增,而這樣的正面效益循環,融合了凱因斯和供給學派的精隨。

7

圖七:美國年度赤字GDP比:至2019年都不會跨越警戒線 單位:% 資料來源:美國國會預算室

        當然,從川普本身來看,令我們較為不安的是,缺乏對長線願景的規劃,而這可能正是面臨人口結構重大課題的美國所需要的。不過,川普的諸多政策,對於中短期的美國經濟刺激效用,將是相當明確的。這些刺激措施,搭配原早已處於擴張趨勢的美國經濟,未來要擔心的或許不是蕭條來臨,而是出現過熱的泡沫榮景!

izaax

免責聲明

此評論所包含之資料及意見僅供參考,任何瀏覽網站的人士,須自行承擔一切風險,本評論不負擔盈虧之法律責任。