“Smart Column (February Issue)” The Strong Taiwan Dollar Cycle Reaching a Plateau Phase, the Value of Investing in Foreign Exchange Occurs

Written in January 16th, 2018

The Strong Taiwan Dollar Cycle Reaching a Plateau Phase, the Value of Investing in Foreign Exchange Occurs

Seize the opportunities to invest while it’s low

Entering 2018, though there is the rise of interest rate and tax cut support, U.S. dollars is still performing weak. On the contrary, Taiwan dollars keeps reaching new heights in recent years. The status quo is benefiting the importers and those who are going abroad, while presenting the investors a great opportunity to do long-term investments.

If we look at it from a long-term perspective (5 years), the outline would be clear. Taiwan dollars currently is appreciating against all major currencies (except U.S. dollars) (as in Chart 1). In other words, the price of Taiwan dollars is now at a relatively high spot in the past 5 years. So why do we believe that this year, especially the first half of this year, will be a great opportunity to invest in foreign exchange? There are two reasons. First, from the economic statistics, Taiwan is very likely reaching top of the market boom this year. Second, the future rate rising of foreign exchange is looking better, and they are at a low point comparing to Taiwan dollars, which in long-term would have the opportunity to gain the profits from both exchange rate and interest rate.

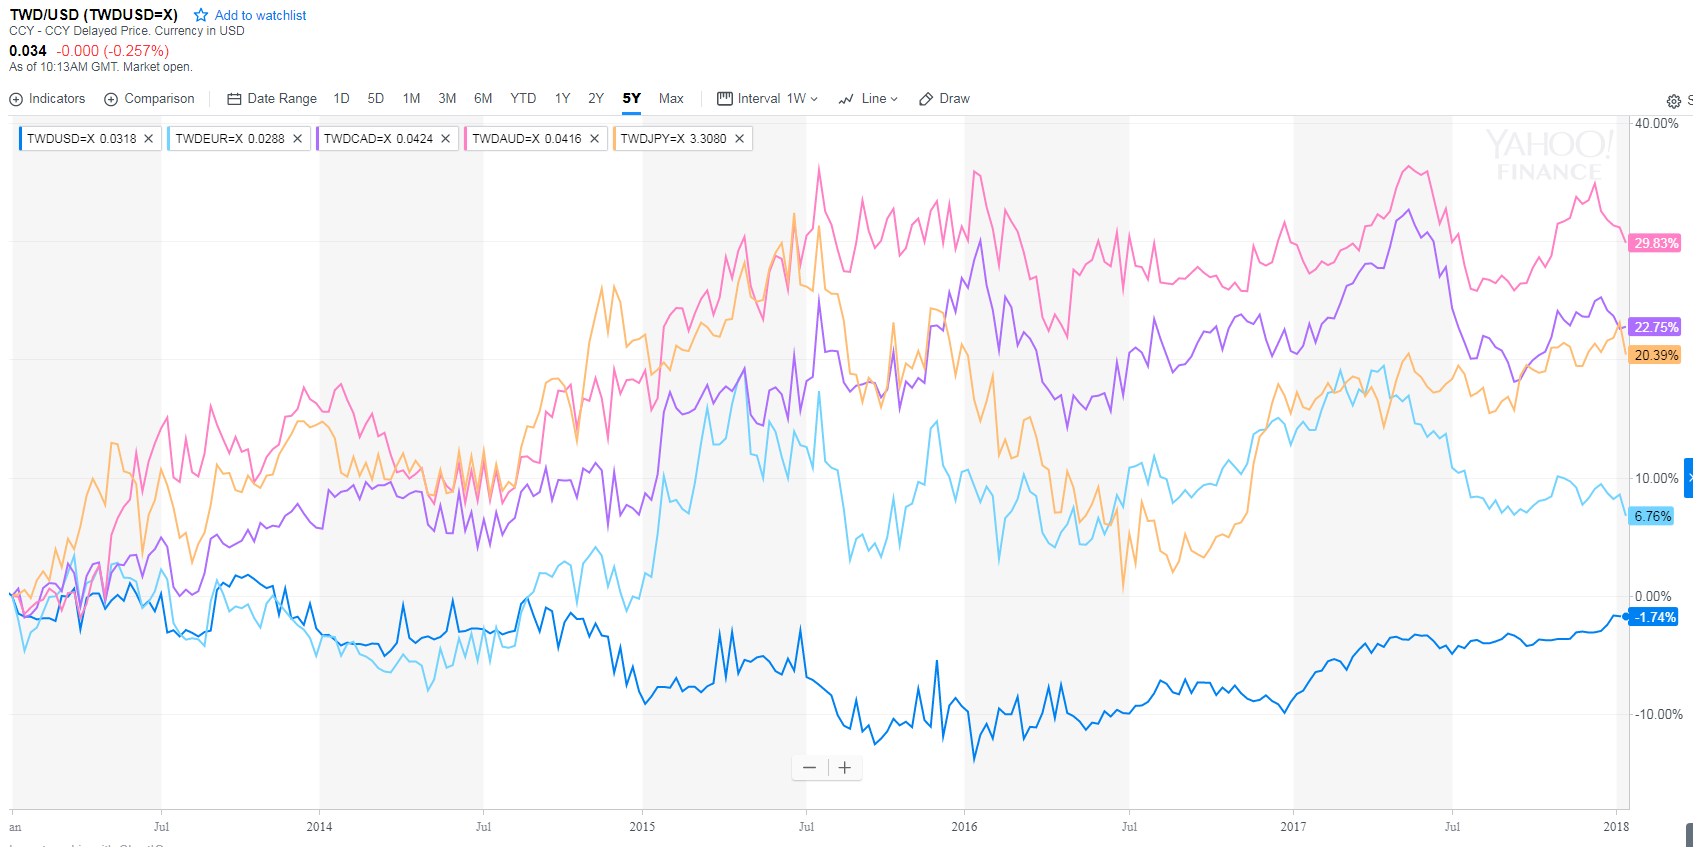
Chart 1: Trend of Taiwan Dollars against other major currencies (Based on the right axis, from top to bottom, AUD, CAD, JPY, EUR, USD.) Performing strong in the past 5 years.  Unit: %  Source: Yahoo Finance

This article will analyze in two perspective telling you: 1. Why this is the year that Taiwan dollars will decline? 2. How to safely do long-term investments in foreign exchange?

The reason that Taiwan dollars would likely decline this year, is based on two fundamental elements in economy:

A. The foreign demands are slowing down, limiting the space for Taiwan dollars to appreciate.

Despite many would blame the Central Bank’s maneuver of the Taiwan foreign exchange rate, this is actually a mistake of reversing the cause and effect. The decision-making of the Central Bank still largely relies on the actual economic status. And over the past 20 years, due to the lack of domestic investments, and the slow-growth of consumer spending, the entire economy of Taiwan begin to rely more and more on outer demands, which are the oversea orders and exports. We can see it in Chart 2, Taiwan dollars is basically connected to the oversea orders’ numbers. The black line and the blue line in the chart indicate the decrease (decline) or decrease (expand) of oversea orders. We can learn that as the outer demands of Taiwan is growing strong, Taiwan dollars would perform a long period of appreciation trend. On the other hand, when the oversea orders begins to fall, Taiwan dollars would start depreciating. From a long-term perspective, the time of expanding is longer, and the time of declining is shorter. Therefore, the appreciation trend of Taiwan dollars would usually go for several years, and the downturn would often come suddenly and drastically.

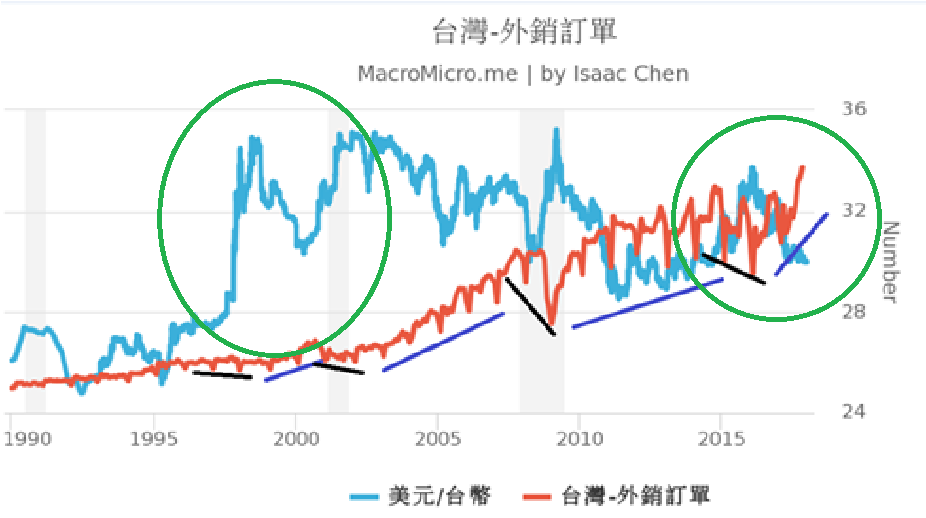
Chart 2: USD to NTD exchange rate vs Oversea orders YoY  Unit: Exchange Price, %  Source: Macromicro.me

Looking at chart 2, after Taiwan’s oversea orders started growing out of the decline in 2016, and continued to have a strong expanding cycle, in which it can be compared to the tech stocks boom in 2000. Thus, Taiwan dollars began a strong appreciation progress like in 2000, 2007-8, 2010-11. A point to take interest in is that in chart 3, according to the trend of Taiwan oversea orders, there are two markets that need to be watched closely, U.S. and China. Recalling back in April, 2015, we have reminded our readers ahead of the markets that the stock market and foreign exchange market will be facing a downturn, due to the rapidly grossing oversea orders from U.S. (accounted to i6s orders) has reached its maximum and can no longer sustain, and the oversea orders from China keeps falling. Yet, the stock market and foreign exchange market were at an unreasonable high price, hence the downturn would be inevitable. Later, as it soon turned out that in the Q3 of that year, the stock market and foreign market in Taiwan both suffered huge loss. As it moved to October, 2015, when the market is filled with pessimistic views, we sowed to find a light of hope in the oversea orders, which is the U.S. oversea orders YoY has returned back to 0, and as the U.S. economy becomes steady, the situation would not get any worse. And the exports to China basing on the low baseline, is slowing climbing back from the decline. This indicates that even though the entire oversea orders haven’t recovered yet, the leading U.S. and China orders already implied that the growth is coming. Then, Taiwan stock market and foreign exchange market begin performing strong until now.

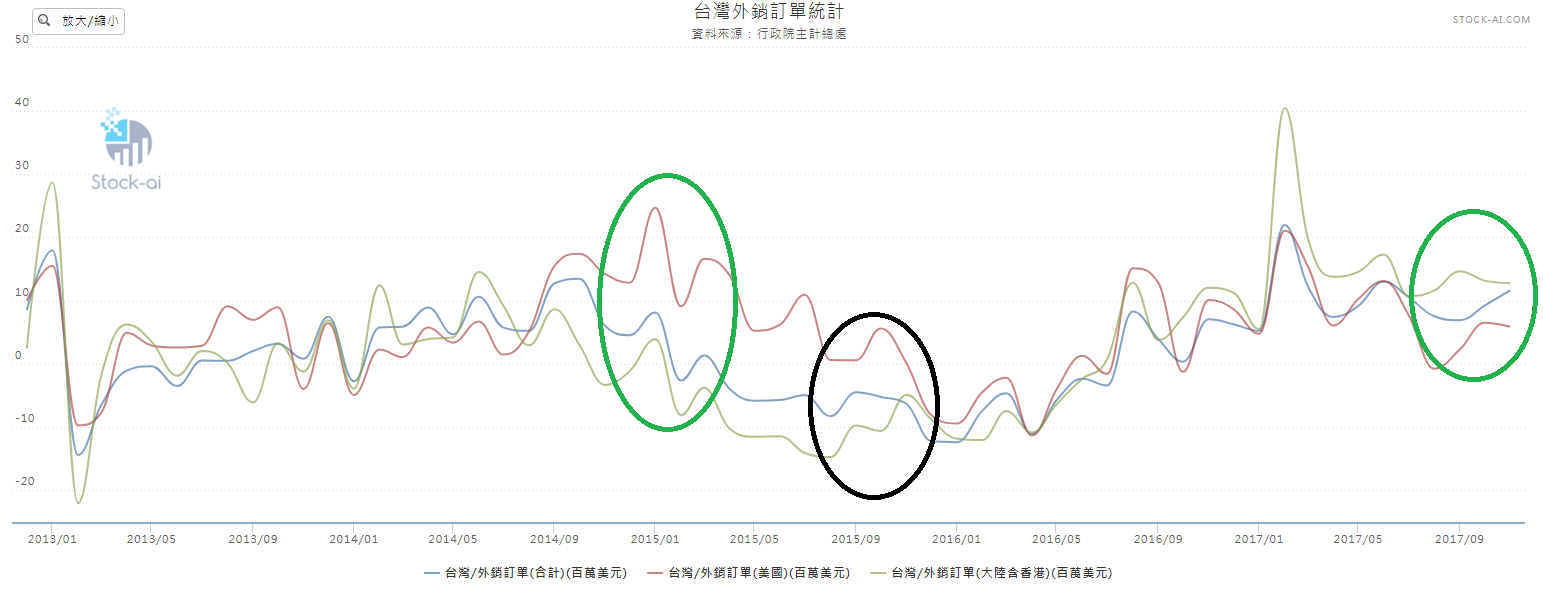
Chart 3: Taiwan Oversea Orders YoY  Unit: %  Source: Stock-Ai

What about the present? we can see that the entire oversea orders are still rising, but the most important ones like U.S. and China are already at a high position in oversea orders for a long period of time, and starts to show signs of falling. Certainly, the overall numbers are still ideal, unlike 2015 that would have an immediate crisis of declining. Yet, the growth of oversea orders would certainly go into a plateau phase. Under such circumstance, Taiwan dollars would be difficult to remain appreciating.

B. The pressure of inflation in Taiwan is low, and the domestic demands growth is mild, leaving tight space to raise interest rate

The second reason regarding the macro-economy aspect that Taiwan dollars keeps appreciating is that this year the entire economy of Taiwan is still only gradually expanding. Looking at Chart 4, the domestic demands has a nice increase due to the low baseline, but still lacking the energy to boom. When the baseline keeps building up, such numbers would begin to slightly decline in the second half of this year. The inflation has been going up since the price of raw materials are rising, but overall they are still in a low level, and would be hard to keep rising up to 2% level later on. Additionally, real estates and private sector investments are still performing weak, leaving there opportunities to raise the interest rate this year, but probably not too many times. It would likely be once (for 0.25%) or twice (for 0.125% each). All in all, it would be a limited rate rise in this expanding cycle.

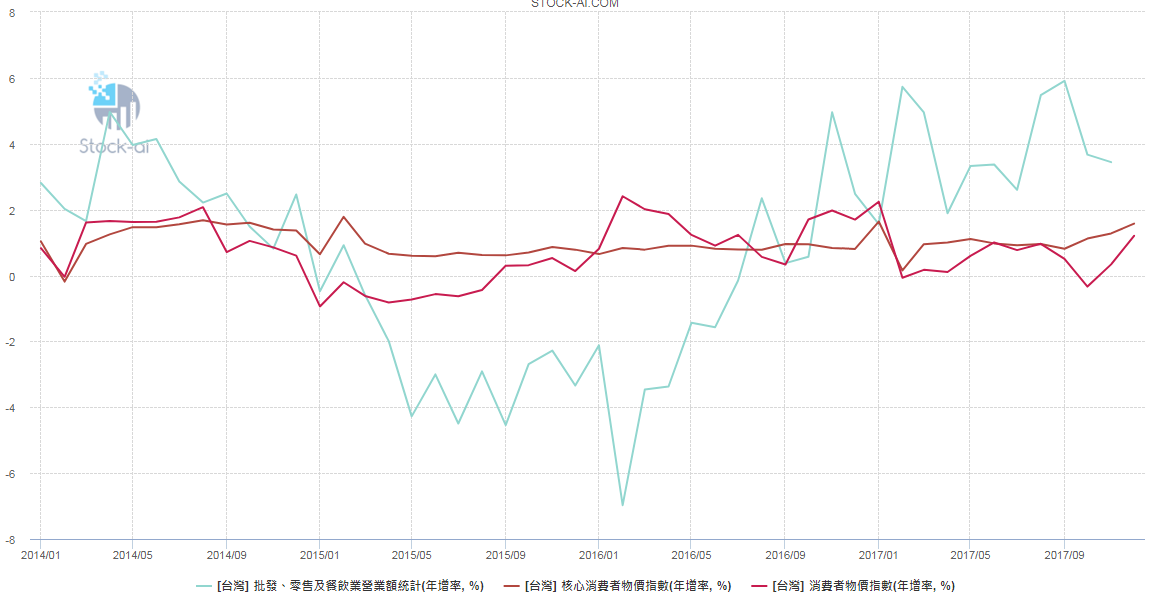
Chart 4: Taiwan Wholesale, Retail and Food Sales vs CCPI vs CPI YoY  Unit: %  Source: Stock-Ai

Obviously, regarding the inflation there is one variant. If the price of imports keeps rocketing, it would cause a pressure on the inflation and rate rise for Taiwan. And since Taiwan relies heavily on importing raw materials, such circumstance would hurt the trading environment,  the earnings of the current account would go down. Plus, the inflation caused by the rising price of raw materials usually won’t be sustainable (because once the baseline is piling up, if the growth cannot keep up, it would lead to a pressure on having deflation). The rising price on raw materials would also cause the manufacturing costs to go up in Taiwan, and the core consumer spendings to go down, which is bad for economic growth and corporate earnings. These elements would become a drive to depreciate Taiwan dollars in long term. Simply put, Taiwan dollars this year would possibly come to a high spot as the tech industries and overall economy grows, and then it would linger at the plateau phase for a period of time (about 2-3 quarters), then very likely to start declining afterwards.

As to foreign exchange, what to invest?

What is the preferable choice for investing in foreign exchange? Immediately everyone would think of U.S. dollars. Apparently, as Taiwan dollars keeps depreciating, U.S. dollars going into a steady rise of interest rate, it would seem proper to invest in U.S. dollars. However, from a long term perspective, currencies for raw materials would be a better option. As Chart 1 has clearly shown, Taiwan dollars against other major currencies for raw materials like AUD or CAD, is at a historical high price. But, Taiwan dollars is arriving at the end of its strong performance. As to AUD and CAD, like we have suggested in last June and October as a great opportunity to buy in at a low price, looking at Chart 5, AUD and CAD have clearly started to go strong after falling to a low level, and it is just the beginning of the trend.

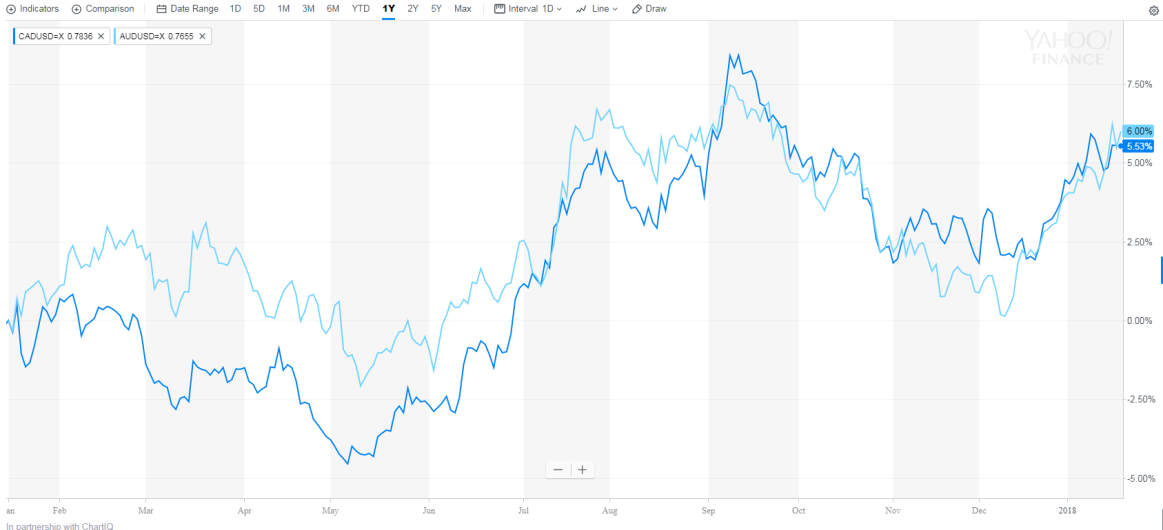
Chart 5: CAD against USD (deep blue) vs AUD against USD (light blue)  Source: Yahoo Finance

The main cause is that both countries are presenting good progress in terms of overall economy and monetary policy. Chart 6 shows that the inflation numbers of Canada is the same as U.S., gradually climbing back to the 2% zone. Chart 7 shows that the domestic demands of Canada and Australia are expanding steadily, allowing both countries’ GDP growing back to 2% level of increase. The numbers are continuing to support that both countries’ troubles in economy are over. Then, the monetary policy or exchange rate would definitely react to such improvements. The historical low price of exchange rate we now see would definitely not remain long.

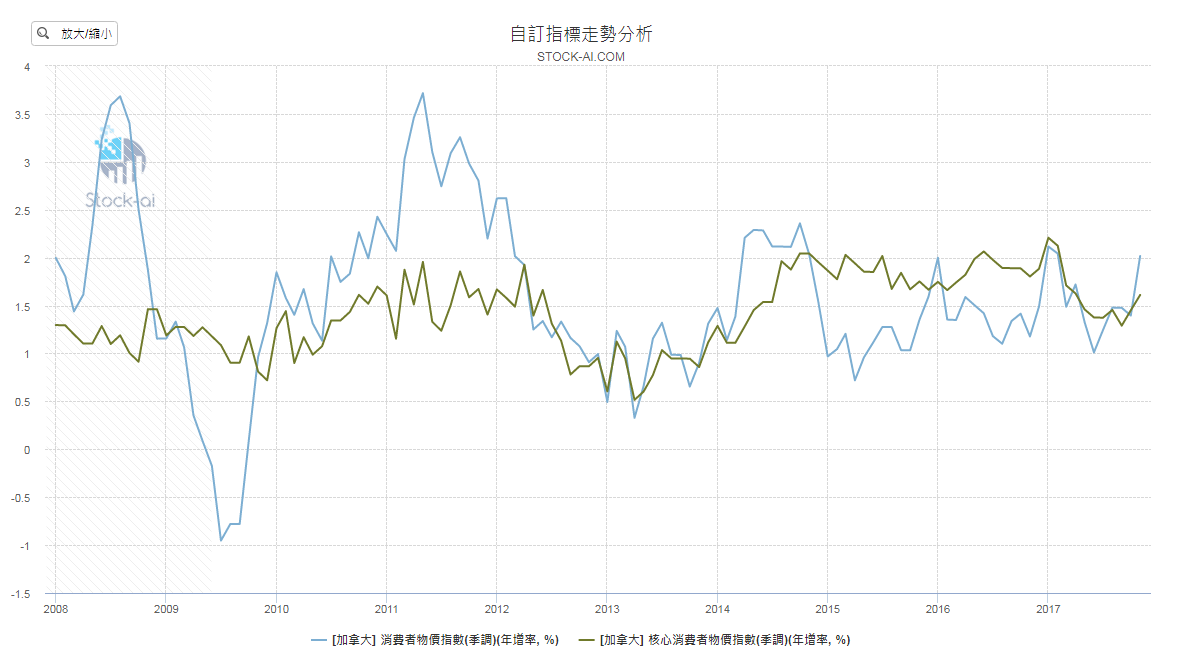
Chart 6: Canada CPI vs CCPI YoY  Unit: %  Source: Stock-Ai

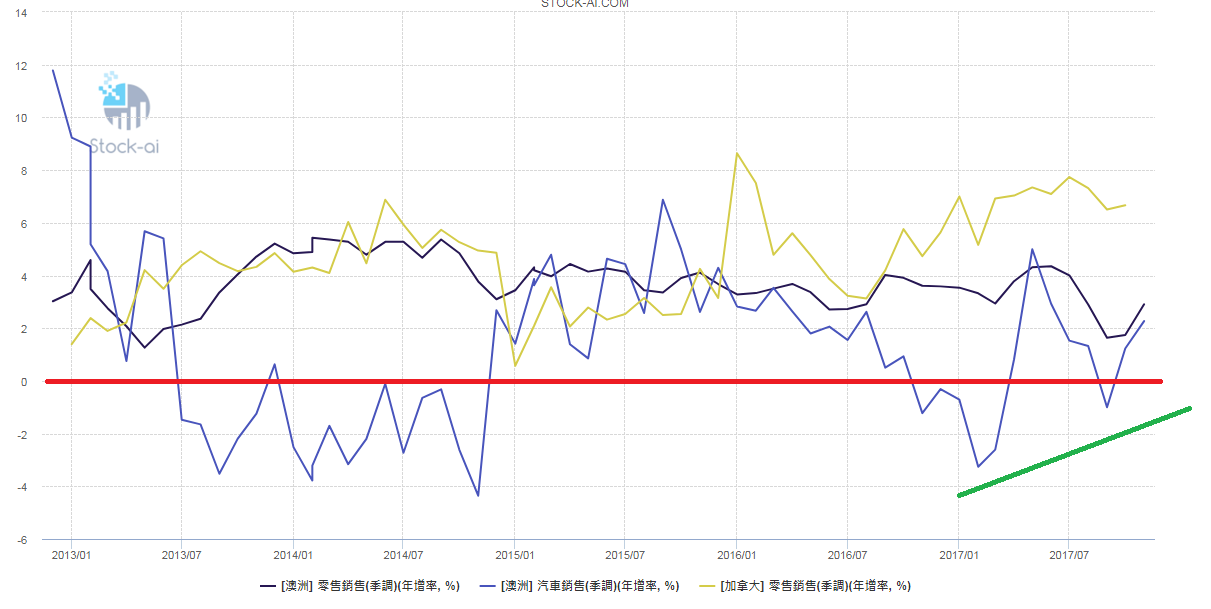
Chart 7: Australia Retail Sales vs Australia Automobile Sales vs Canada Retail Sales YoY  Unit: %  Source: Stock-Ai

Besides currencies for raw materials, U.S. dollars this year would likely to start performing weak, leading to the opportunity to invest in Euro dollars. We estimated that only 25% of the chance this year U.S. dollars would go strong, and 75% of the chance that Euro dollars would go strong. The main factor at work here is the future of the currencies of both regions.

Despite the bounce back of Euro dollars since last year, in a historical framework, the current spot is only at 1.18 as the price when it first established in 1999. If we apply the interest rate parity theory, the exchange rate would flow from high interest rate (high inflation) countries to low interest rate (low inflation) countries, then currently the Euro dollars are being under-valued. In other words, if the trend of economy growth of both regions remains the same, the fundamental aspect and monetary policy aspect (leveling the gap between the two sides across the Atlantic ocean) that Euro has to reflect, would make it possible for Euro to start a long term boom later this year.

As to the possible outcomes of U.S. and Europe currency environment this year, what would it be? Basically, only few outcomes as followed.

1. U.S. continues tight monetary policy, Euro begins tight monetary policy: U.S. remains the tight monetary policy, while Euro at Q3 this year starts adjusting negative interest rate and proceeds with further QE cut. Under such circumstances, Euro would begin a long term boom. Since FED’s tight monetary policy has been realized by the markets, and Euro’s upcoming tight monetary policy still has room for maneuvering (Ending QE, further raise of interest rate, or even shrinking balance sheets).

2. U.S. slows down its tight monetary policy, Euro delays its tight monetary policy: This is a possible scenario as well. If U.S. raises the interest rate to about 2% or the amount of shrinking balance sheets reaching 50 billion dollars, it would begin to cause pressure to the capital markets and economy, then FED would probably slow down the rate rise and shrinking balance sheets. If that is the case, then theoretically Euro would follow U.S.’s footsteps, and stop entering next tight monetary policy process. However, under such circumstances, due to U.S. freezes the tight monetary policy, it would impact the confidence in holding U.S. dollars, leading to U.S. dollars starting to perform weak.

3. U.S. slows down its tight monetary policy, Euro begins tight monetary policy: This is a scenario that has a smaller chance to happen, but not entirely impossible. If U.S. slows down the tight monetary policy, and Euro enters a new round of tight monetary policy in Q3 due to its strong economy and inflation numbers. This outcome would bring the Euro to a huge boom.

All three scenarios above are indicating that Euro dollars would have a boom. Probably only the next scenario would cause the Euro to go weak.

4. Euro slows down tight monetary policy, U.S. speeds up tight monetary policy: Since Euro economy and inflation numbers are under performing, and U.S. economy and inflation numbers are rocketing, U.S. would continues to apply tight monetary policy while Euro decides to slow down the pace of its tight monetary policy. Under such circumstances, due to the gap of two regions’ monetary policy is widen again, Euro would drop and even reach a bottom. Yet, looking at the scale of global economy, this is highly unlikely to happen, because Euro is on the track of reviving. If U.S. economy can maintain its healthy growth, it would help drive Euro regions to perform strong in economy. Thus, it is unreasonable to have such gap between two regions.

Based on the analysis above, after the Q1 this year, the chance of U.S. dollar to go strong is only 25%.

Therefore, the targets of investment for foreign exchange this year, should be raw materials currencies first, Euro second, and then U.S. dollars. The timing for investing can mainly rely on observing two events, the first one is the time that FED raises the interest rate again this year (3/20-21). U.S. dollars has been performing weak since the end of last year, and would likely bounce back around such time period, making it a good chance to do foreign exchange (raw material currencies and Euro). The second event would be if the Central Bank would begin the discussion of raising the interest rate first half of this year. When the news of raising the interest rate is out, Taiwan dollars would be expected to show a last rise, and it would be a great time to do the foreign exchange (raw material currencies, Euro, U.S. dollars). All in all, seizing this rare opportunity that Taiwan dollars are going strong, and dividing investments into foreign exchange, would help protect your assets and portfolio from any fluctuation of exchange rates in the future.

izaax

Disclaimer

The information and comment in this article is for reference only. Readers using this website should acknowledge that the company shall not be liable to you for any direct, indirect, punitive, incidental, special or consequential damages arising out of or in any way connected with the use of or access to the website or for any information obtained through the website. Any reliance upon any such opinion, advice, statement, memorandum, or information shall be at readers’ sole risk.


“Smart Column (January Issue)” The Falling of Global Tech Stocks is an Adjusting Phase Towards the Final Boom

Written in December 18th, 2017.

The Falling of Global Tech Stocks is an Adjusting Phase Towards the Final Boom

An opportunity to buy carefully for the possible new height in price of the industry

Arriving in December, President Trump’s tax reform has encouraged a new climax in the U.S. stock market. Yet, the tech stocks that have been doing well over the year, are suddenly facing an invisible wall. Looking at Nasdaq, SOX, or tech-stock based stock markets like Taiwan and China, are all performing weak in trend. What does this phenomenon of weak performing mean exactly? Is it the beginning of a downturn of the economy, or a resurfaced opportunity to invest? It is our belief that even though the price of the stock market is rather high, and the economy cycle is gradually pacing towards a later phase, the expanding cycle of tech industry is not yet over. The falling and adjusting of the stock markets this time is a step towards a greater boom. Investors should seize this opportunity and invest with caution.

We are optimistic that in the near future, tech stocks would take the lead again, and become a major force in the later phase of the bull market, for four fundamental reasons:

1. U.S consumer spending and consumer electronics retails are growing strong:

The first thing we need to look into is the U.S. consumer spending needs, and a prior background knowledge needs to be addressed here first. This article will not be discussing market needs other than U.S., and for a reason: The current global consumer spending increase, especially the technology products sales, is basically driven mainly by the U.S. We can see it in Chart 1, though China, Europe and Japan, and other emerging markets are also with enormous economic volume, when looking at the volume of domestic consumer spending, they still have a certain gap comparing to the U.S. (The domestic consumer spending total in U.S. roughly equals to China, Japan, Germany, India, Britain, and Brazil combined). In other words, the status of U.S. domestic consumer spending alone is enough to determine the trend of global consumer needs. Applying it to the analysis, as long as we can ensure the exact trend of U.S. consumer spending, pairing it with the leading role of U.S. in technology research and development and sales, we can have a better understanding of the layout of the global industries. Thus, there is no need to do other pointless analysis.

Chart 1: In 2006, the volume of U.S. domestic consumer spending alone is 44% of the top 10 countries combined.  Unit: Million of Dollars  Source: Euromoniter International

Looking at Chart 2, U.S. has gone through a stronger Q2 and Q3 in economic growth (at 3.1% and 3.3%), yet the growing pace is still going. The latest sales report in November has indicated that the domestic consumer spending has come to a high spot that is rarely seen over the past few years, with YoY growth at 5.8% (the YoY in Chart 1 indicates the advance real sales YoY that has deducted inflation influence, still the over 3% growth is the highest over the past three years). The consumer spending will be even stronger coming into the shopping season, meaning that the GDP in Q4 will undoubtedly reach over 3% in three consecutive quarters. How difficult can it be? Last time we have seen a three consecutive quarters GDP YoY over 3% is back in 2005, which is 12 years ago! After a year that President Trump took office, this is a pretty impressive performance in economy.

Chart 2: Advance Real Retail and Food Services Sales YoY (Red) vs Advance Retail Sales of Electronics and Appliance Stores YoY (Blue) – both perform well, and the sales of electronics keep rising  Unit: %  Source: FRED

Would such strong performance in economic expansion benefit the tech industries then? It would all depends on the consumer spending. Looking back in the past 30 years, we can realize that even in the period of economic expansion, electronics sales has its pattern and cycle. When the growth has lasted for 3-4 years, it would arrive at a plateau period and then facing an adjusting phase or even a bigger decline. In a normal economic expansion cycle, a negative growth period as in 2015-16 is a rare occurrence, which is also the main reason that Taiwan stock market (2015) declined into an adjusting phase from the 10,000 point mark. However, starting in the second half of 2016, the needs for electronics has increased drastically, reaching at 6.4% in YoY in November, a best record since 2011. Referring to the past experience, when the trend of electronics sales is certain, the chance of it going the other way is unlikely. Thus, it is safe to say that the technology consuming cycle is not yet over.

2. Economic growth and tax cuts will stimulate the private sector investment in U.S., benefiting tech stocks

Besides consumer spending, another source driving the growth of tech industries is the private sector investment. Considering that when building a competitive edge in production and sales, the needs for upgrade in both technological hardware and software have always been the backbone of private sector investment. And judging from the past experience, the expansion of corporate profits (Chart 3) is essential to the growth of private sector investment. A certain order is related to the both, in short, the growth in profits would encourage the needs of investment, but excessive investment would eventually kill the expansion in profits. Thus, the expansion in profits would take place first, then the bigger investment frenzy would initiate. We can see it in both 2001 and 2009 at the beginning and the end of economic cycle, that the corporate profits has improved significantly, and the private sector investment began to increase gradually. And since that in 2015, U.S. and the global economy have faced a setback causing the corporate profits to fall, also slowing the pace of private sector investment. Yet, we can clearly see that this year, corporate profits is starting to improve significantly. Combining it with the fact that as the tax cuts deploy next year with a booming economy, the corporate profits will definitely climb to a different level, resulting in a new expansion of private sector investment.

Chart 3: US Corporate Profits (Black) vs US Gross Fixed Capital Formation (Blue)  Unit: Billion of Dollars  Source: Tradingeconomics

Let’s look at another more acute numbers! The important categories of New Orders for Durable Goods (detailed in my publication) that we continue to follow. As in Chart 4, whether the New Orders for Durable Goods of Computers and Electronics Products (Red) that representing the whole industry aspect or the New Order for Durable Goods of Electronic Components (Blue) that relating more to Taiwan, both have reached a new height in October since the economic recession, and the growing trend keeps going strong. Noticeably, the situation of this industry expansion seems to have rid of the patterned cycle since 2000, and more like the industry boom bubble back in the 90s. Still, whether it would become such a trend still need more observation, but as the private sector investment remains increasing, the boom of tech industry would not suffer the downturn at this moment.

Chart 4: U.S. Durable Goods: New Orders for Computers and Electronics Products (red) vs New Orders for Computers and Electronics Products: Electronic Components (blue), both have reached a new height in the decade.  Unit: Million of Dollars  Source: FRED

3. Tax Reform will not be a short side for tech stocks, tech stocks profits are still growing fast

Finally, we will be discussing that since President Trump’s Tax Reform made a breakthrough in the GOP majority Congress, the market begins to see tech stocks and the tech industry as a “punished” industry, which is a huge misconception. Obviously, as Goldman Sachs has evaluated, since the real effective tax rate is lower, after the Tax Reform is passed, the overall profits of the tech industry will decrease, unlike other industries (Chart 5). Yet, this does not constitute a reason to look down on tech stocks, how so?

Chart 5: After the Tax Reform, the profits of the tech industry will decrease.  Unit: %  Source: Goldman Sachs

The reason is simple, tech industry is still the one industry that has the most potential in earnings. We can see it clearly in the Factset report, tech industry is one of the few that keeps adjusting the forecast of earnings upwards. As in Chart 6, 7, 8, the forecast of earnings in Q4 2017, 2017 and 2018, the adjusted values have all surpassed the forecast values. The speed of growing earnings of the whole industry this year, is only behind the Energy/Materials industries due to their low baseline last year. Even comparing it to the Energy/Materials and Financials industries (low baseline this year as well) next year, it only falls a bit behind, which the earnings growth is better than the market for two consecutive years. If such trend is solid, then the decline this time due to the market atmosphere, would be a good opportunity to invest.

Chart 6: S&P 500 Earnings Growth: Q4 2017

Chart 7: S&P 500 Earnings Growth: CY 2017

Chart 8: S&P 500 Earnings Growth: CY 2018
Source of the above: Factset

4. Oversea capital reflux due to Tax Reform will significantly benefit the tech industry

The last point that most have neglected, is the tax cut for oversea capital reflux that the Tax Reform planned to do. This could stimulate the tech stocks in both fundamental aspect and issue aspect. Why? The reason is that once the reflux of huge oversea capital occurs, they can only be utilized in three ways: 1. raising the payroll to maintain the competitiveness and attraction of the corporations in the job market. This would then encourage the overall consumer spending, and as we have mentioned in the first part of this article, consumer spending and tech consuming cycle is highly related, which is the first good news. 2. More possibly, the corporations would use the capital to do necessary investments, and as the second part of this article mentioned, private sector investment frenzy and the tech cycle is highly related too, which is the second good news. These two points are basically the trend following the fundamentals.

But the one that has more potential is the third aspect, the stimulation of the issue aspect! When the huge oversea capital reflux occurs, they would likely be used to issue more dividends, apply treasury stock, or conduct business mergers across or within the industries! Then, the ones that possess more oversea capital will be the ones that become the center of attentions in the market next year.

Chart 9: S&P 500 total sum of oversea earnings, mainly concentrated on tech stocks.  Unit: Billion of Dollars  Source: Factset

Form 1: Top 10 U.S. companies with overseas cash/total cash & marketable securities, including 6 tech companies and taking the top 5 spots.  Source: Bloomberg

What are the companies? As in Chart 9, the tech industry is obviously the one that has the most capital overseas. Form 1 also indicates that top 10 U.S. companies that hold most overseas capital, there are 6 tech companies (GE excluded) in them; comparing to other industries, they have a crushing advantage. In other words, if the Tax Reform is passed successfully, looking from fundamental aspect or issue aspect, tech stocks should not be the abandoned ones in 2018. More likely, they will be great investment opportunities that investors should wisely invest, and wait for the industry to reach its height to receive a rewarding gain.

izaax

Disclaimer

The information and comment in this article is for reference only. Readers using this website should acknowledge that the company shall not be liable to you for any direct, indirect, punitive, incidental, special or consequential damages arising out of or in any way connected with the use of or access to the website or for any information obtained through the website. Any reliance upon any such opinion, advice, statement, memorandum, or information shall be at readers’ sole risk.

“Smart Column (March Issue)” Cheap U.S. dollar presents the opportunity to buy in, waiting for another grand bull market trend to reappear.

Written in Feb 13th, 2017. 

Cheap U.S. dollar presents the opportunity to buy in, waiting for another grand bull market trend to reappear.

US Dollar Index will reach a new height since the recession.

In the course of the past two years, as United States ended the QE stimulus programme and started the rate-rising cycle, US Dollar Index has begun its long-term bull market trend. However, since the market fluctuates rapidly, if investors fail to trade in the right moment, starting to move along with the market atmosphere, it would often end up chasing for nothing. On such note, it is pleasing to see that over the past two years, we have pointed out in June 2015 and July 2016 that the right timing for buying US dollars (see chart 1). And by reviewing the outcome, our strategy is spot on. In this article, we are to inform you that after the correction happened at the beginning of this year, US Dollar Index is now showing an excellent opportunity to invest, and this time the gain will be significant.1

Chart 1. The red circles show the timing when we predict longing U.S. currency over the past two years, providing investors decent returns.  Unit: index  Source: Marketwatch

Why is the upcoming quarter the perfect opportunity to invest in US dollars? There are three major factors based on the economic fundamentals that will lay out a great chance to buy in at a lower price.

A. The trading statistics indicate that US dollars will go weak then strong.

2
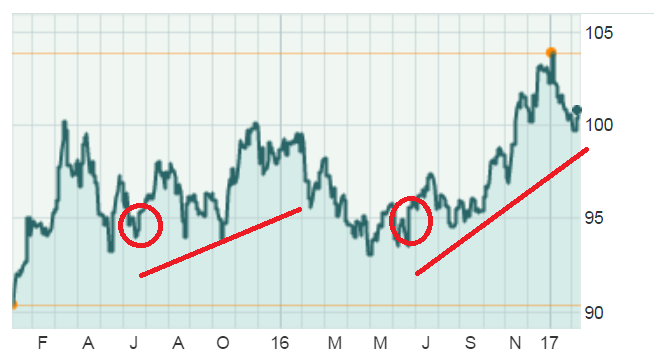
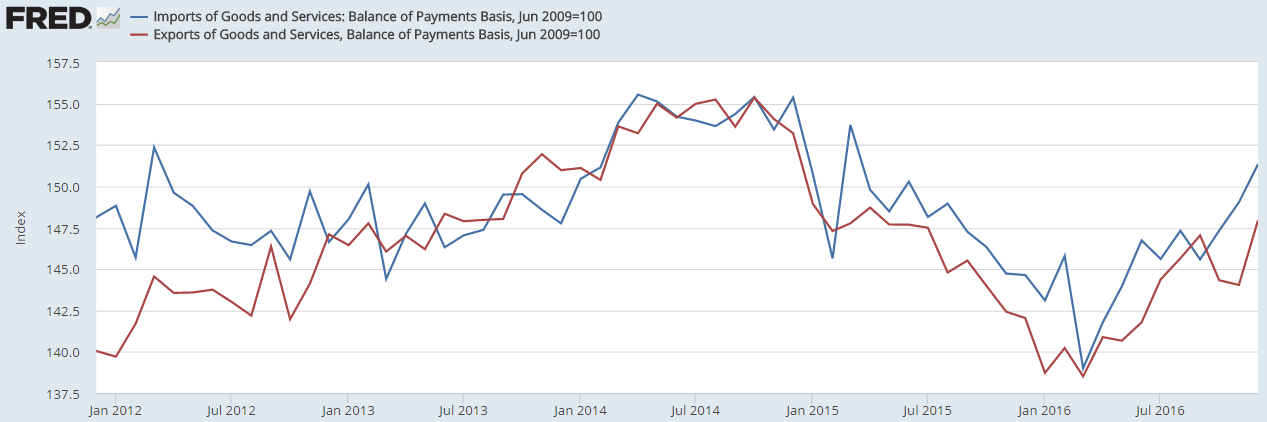
Chart 2. U.S. imports (blue) vs exports, imports is speeding up faster than exports.  Unit: index   Source: FRED

As the US and global economy are starting to expand prominently, the status of US import and export keeps getting better (see chart 2). Specifically, the import numbers are showing a great acceleration. It suggests that besides the increasing actual needs that contribute to the numbers, there are other factors at play! What is the cause of it? Basically, it is related to the Border Adjustment Tax that President Trump and Republican congress are beginning to discuss. The new tax bill is going to charge all import goods a 20% import duties (the tax rate is undetermined; it resembles other countries’ import value-added tax), and duty free for export goods. The bill will be going through the legislative process approximately this spring; therefore, companies with import business will begin to increase their imports as early as possible, in order to avoid the impact of the new tax bill. And due to the recent spike of sales in US, the inventory level has come to a new low point of the last two years. Thus, the increasing needs for import goods will become more apparent in the next six months (see chart 3).

3
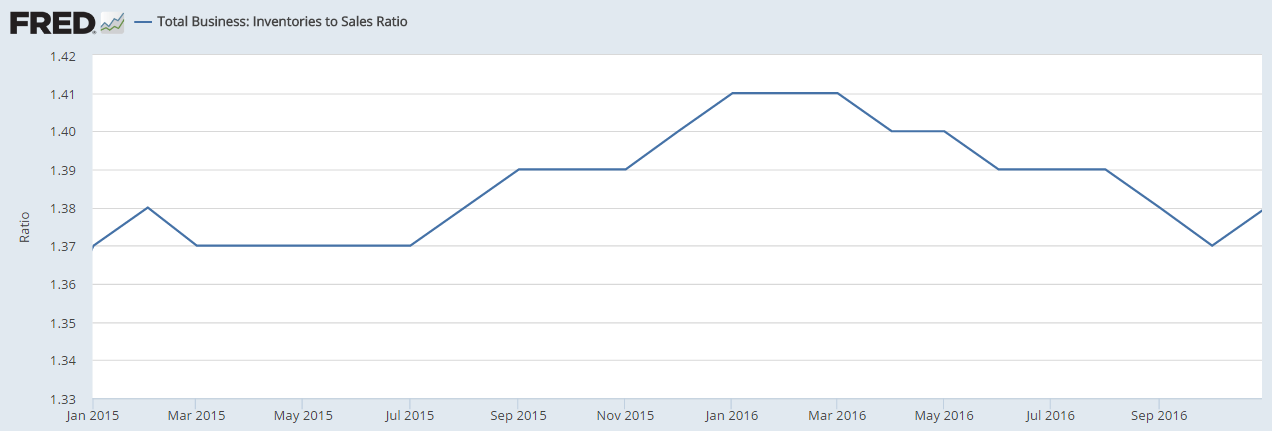
Chart 3. U.S. inventories to sales ratio: steadily improved in last year, companies worked hard to digest inventories.  Unit: %  Source: FRED

Under such circumstances, since that current account is the key element to determine the long-term trend of exchange rate, during this short period of expanding imports of goods, US dollars will suffer from certain pressure, and also affecting the trend of other currencies. However, making early expansion of imports still has a limit. As the details of the new policy settled, and putting in motion in the 4th quarter this year (new fiscal year in 2018) to next year, such increasing needs for imports will be replaced by another cycle of dealing with inventories. Then, the whole trading trend and other non-US market’s exports needs will be reversed, or even emerges a bigger need gap. Then, the US trade deficit will significantly decrease, and so will other countries’ trade surplus, which would lead to US dollars appreciating to a new height.

B. The inflation statistics indicate that US dollars will reach the bottom and bounce back.

The second factor that the US dollars will gradually reach the bottom and start to bounce back is the trend of US inflation. It will significantly affect the interest rate of US in the future, and also affect the possible trend of US dollar Index. The numbers of inflation are relative, which means that the inflation numbers of US should be compared to other major corresponding countries. And looking from US Dollar Index’s point of view, it would be the trend of Inflation in the euro area. We can see in chart 4, since 2011, the numbers of US inflation usually are better than the ones in euro area. In that case, the US currency strategy comparing to euro area is rather tighter in a long term period. This is also the reason that the bull market of US dollar has continued for six years.

4
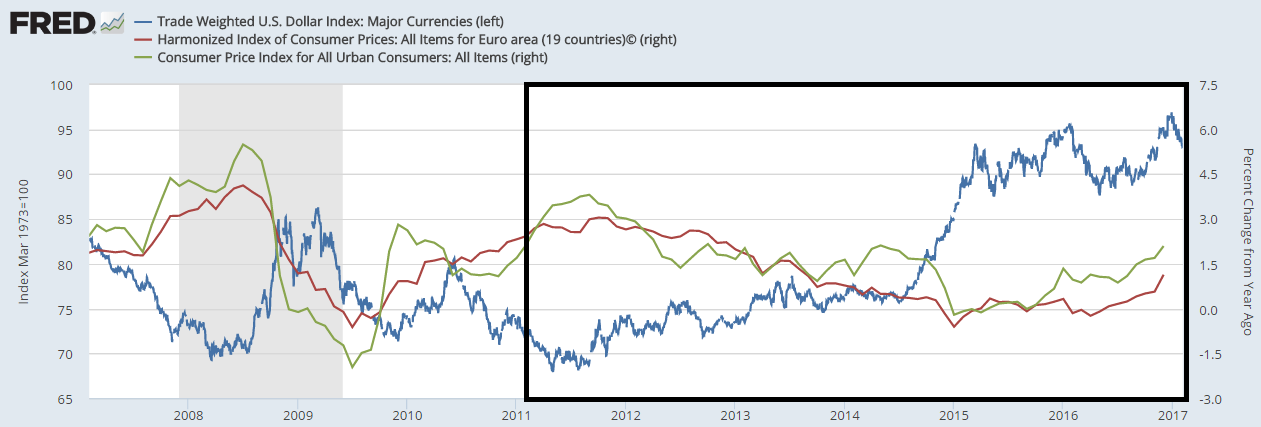
Chart 4. Trade weighted U.S. Dollar Index (blue) vs Harmonized Index of Consumer Prices in Euro area YOY (red) vs Consumer Price Index YOY in U.S. (green)  Unit: index, %, %    Source: FRED

And the most important reason causing the recent euro bounce back, and the US Dollar Index setback, is because of the inflation in euro area has started to warm up. In December, the level of inflation has reached a new height of 1.1% in the last three years. As the base period is lower, the level of inflation in euro area can maintain at 1-1.5% in the first half year. It is safe to say that the deflation crisis of euro area is relieved momentarily. As to the reason that the inflation level can rise in euro area this time, besides from its own gain of economic recovery, a great deal is contributed from the rising oil price and strong US currency. Since the rising price of commodities affect the inflation in both US and euro area, the rise of inflation level in euro area is greatly contributed by the strong US currency. In other words, US currency needs to stay strong, for euro to have the capacity to continue improving through inflation, and in the longer future, has the chance to shift the currency policy and stimulate the euro to appreciate. Yet, this scenario still needs time to accumulate to realize, and it will not take place in this year at least.

Why? The main reason is the new policy of custom duties of Trump government we mentioned above. It will not only greatly increase the imports price level, but also increase the price of domestic commodities (since oil and commodities imports currently do not seem to be duty-free). This will heat up the possible gradual inflation in the later half year that benefits from low base period. Then, combining with a booming employment market, tax cut and expanding infrastructure constructions all in motion, the inflation level and interest rate of US will significantly increase and accelerate, and pushing the US dollars to appreciate.

C. US economic growth is still better than other major countries.

5
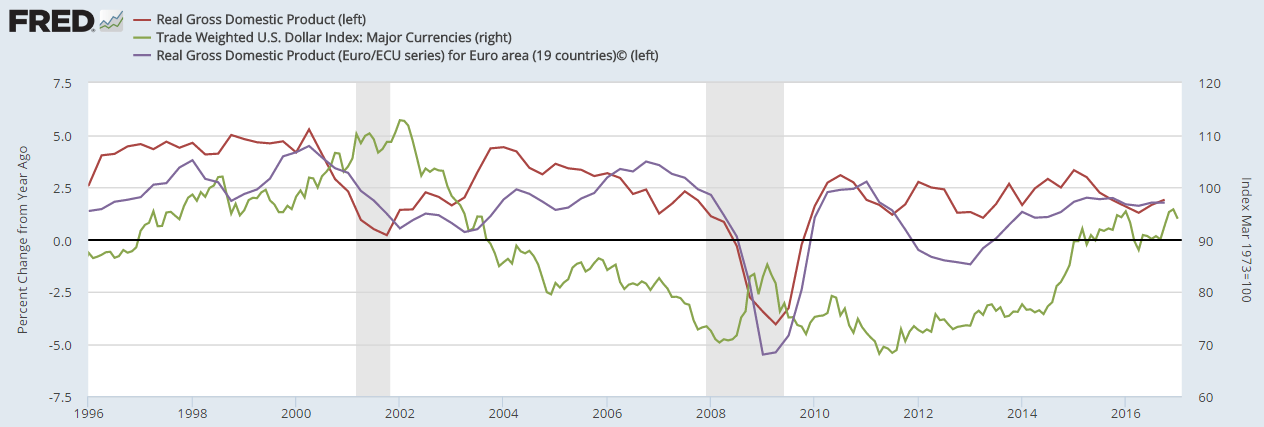
Chart 5. U.S. GDP YOY (red) vs Euro area GDP YOY (purple) vs Trade weighted U.S. Dollar Index (green)  Unit: %, %, index    Source: FRED

The last key factor that will affect global currencies and capital movements, is the economic fundamentals. We can see in chart 5, Trade Weighted US Dollar Index in the past twenty years has gone through two bull market and one bear market cycle. The most important factor relating to this, is that after European Union expanded east, there was a rapid growth in euro area in the beginning of this century, and US Dollar Index is also at a relatively high position. Then, the decline kept moving downwards, until after the recession in 2008. After the recession, due to the European debt crisis and the new emerging European market began to stale, the economic growth of euro area started to fall behind US.

What about the future? Although the economic growth in the euro area last year (2016) finally surpassed US in the past ten years (1.7% vs 1.6%), US Dollar Index also began to go weak in the start of this year, this is not a shift of the long term trend. As shown in chart 6, in the first three quarters of last year (the statistics of the 4th quarter is not yet announced when this article is written), the needs of exports (first chart to the left) has been a great help. Even though the domestic needs in the euro area has increased, it is roughly the same as the recovery base period since 2014. And last year, the private investment and inventories in the euro area for the first three quarters are pretty weak. This circumstance is very different from US, for its economic growth is basically all supported by the private consumption (see chart 7). Last year, the increase of domestic needs in US is doubled than the euro area. The increase of domestic needs is the most important factor of whether the local economy can maintain a long term expansion. In other words, the prominent economy performance last year in the euro area, or to say that the euro area can recover and start heating up the economy, the weak euro currency leading an increase in exports needs is notably the great help.

6
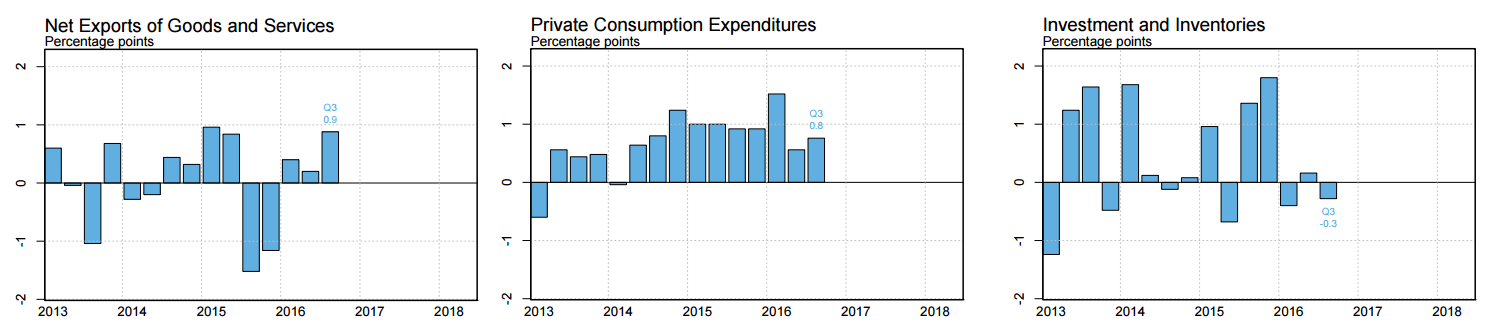
Chart 6. Net exports to GDP (left) , Private Consumption Expenditures to GDP, Investment and Inventories to GDP    Unit: %    Source: FRBNY
7
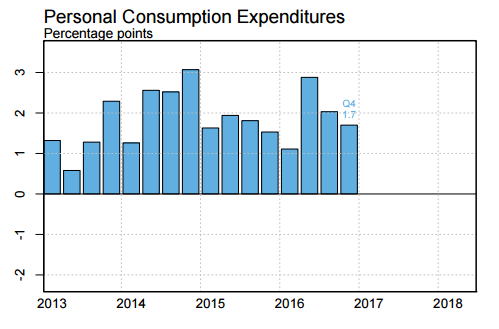
Chart 7. U.S. Personal Consumption Expenditures: supporting the entire GDP growth    Unit: %    Source: FRBNY

Obviously, due to last year’s lower base period of private consumption and investment in the euro area, it should be doing rather well this year. However, the base period of US private investments and inventories is also pretty low, and should be doing pretty well this year. Overall, the euro area still relies on the increase of exports needs, and the benefits of lower base period, thus, the trend of surpassing US economy growth might just be a spark in the pan (the numbers still need to be confirmed and finalized as well since the US GDP in the 4th quarter and last year might have a small increase). This year, US will still beat the euro area in economic growth at about 0.5%-1%. Thus, the bull market trend for the US currency will maintain its course.

Investing timing: seize the moments before the 3rd rate rise and invest separately.

Due to the early imports trend in US, that ignites the market sales and early consumption sales, the price of commodities in the market will rise, and eventually resulting the booming capital market in US and the globe, and heat up the trend of inflation. Thus, whether there would be a rate rise in March or not, it is certain that there will be a third rate rise in the first half year. According to the experience in the past three years, three months before the announcement of major currency policy is the best time to buy in US Dollar Index. The three time period are listed below (can also see chart 8):

  1. October 29th, 2014, US ended the QE stimulus programme (the end of currency easing cycle).
  2. December 16th, 2015, the first rate rise for the past ten years in US (the start of currency tightening cycle).
  3. December 14th, 2016, the second rate rise in US (confirming the currency tightening cycle).

The three time periods are the green circles in the chart below. The purple circles are the periods three months before the according rate policies, which are the best timings to long the US Dollar Index.

8
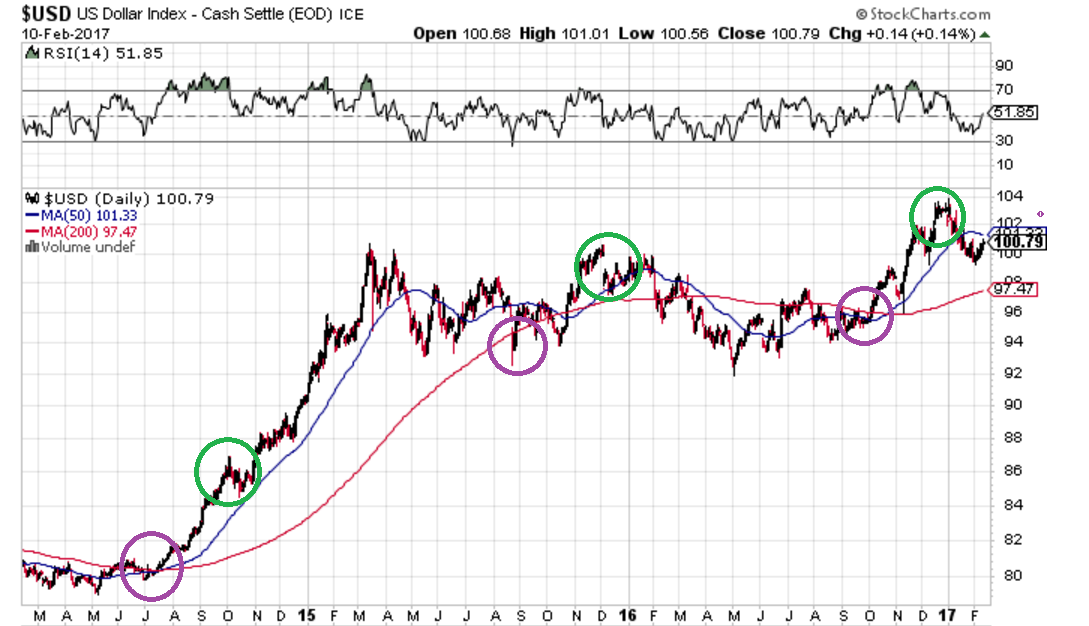
Chart 8. U.S. Dollar Index chart in the past three years: three months before crucial decisions are the best timings to buy in.    Unit: index    Source: Stockcharts

Simply put, investment is to buy at the expectation and sell at the realization. When rate rise is a reality, and everyone is optimistic about US currency, and not so excited about euro and emerging markets currencies at the start of this year, US currency began to depreciate, and euro and emerging markets currencies are doing rather well. And when the public starts focusing on markets outside of US and emerging markets’ increasing economy growth, and neglects the possible impacts of the next rate rise, it would then be a good timing to start invest in US Dollar Index! Besides the US Dollar Index will have a steady position in the upcoming quarters, as the influence the rate rise sets in, it will cause the capital market and emerging markets currency certain amount of pressure. Therefore, you can long the US Dollar Index at a lower price at the time period we have suggested in the past two years, you should also do the exchange of other currencies (including US Dollar Index currencies, CNY, NTD, and emerging markets currencies) to US currency in the second quarter, in order to avoid the depreciation risk resulted from the rate rise cycle each quarter in the US.

Disclaimer:

The information and comment in this article is for reference only. Readers using this website should acknowledge that the company shall not be liable to you for any direct, indirect, punitive, incidental, special or consequential damages arising out of or in any way connected with the use of or access to the website or for any information obtained through the website. Any reliance upon any such opinion, advice, statement, memorandum, or information shall be at readers’ sole risk.


banner